. 2010 Jul 20;8(7):e1000429.
doi: 10.1371/journal.pbio.1000429.

Cryptic variation between species and the basis of hybrid performance

Affiliations

Cryptic variation between species and the basis of hybrid performance

Ulises Rosas et al. PLoS Biol. .

Abstract

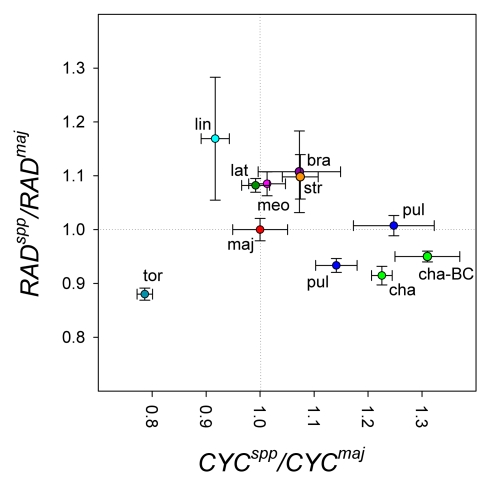
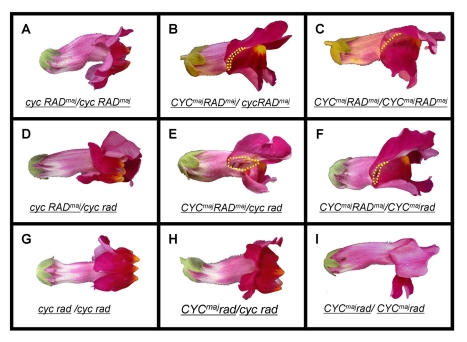
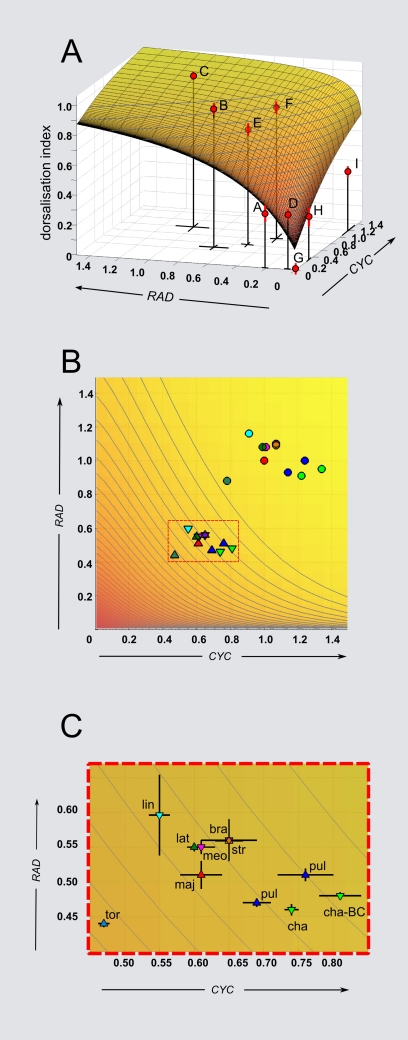
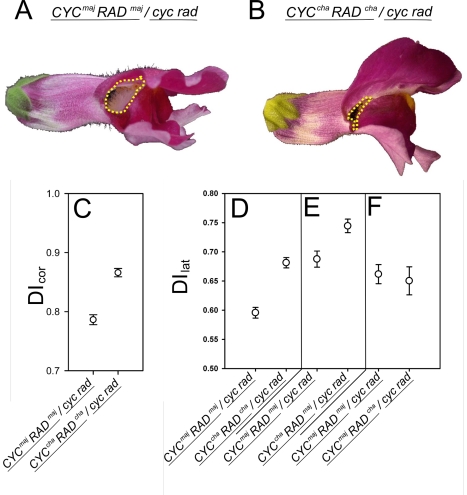
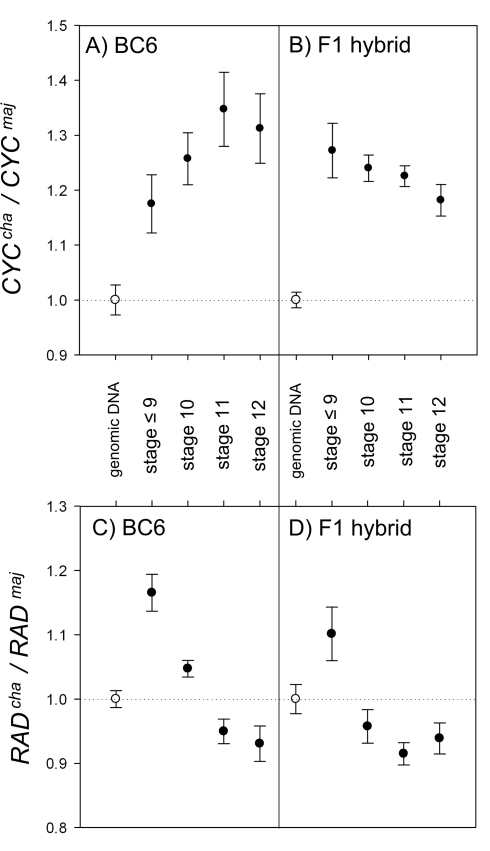
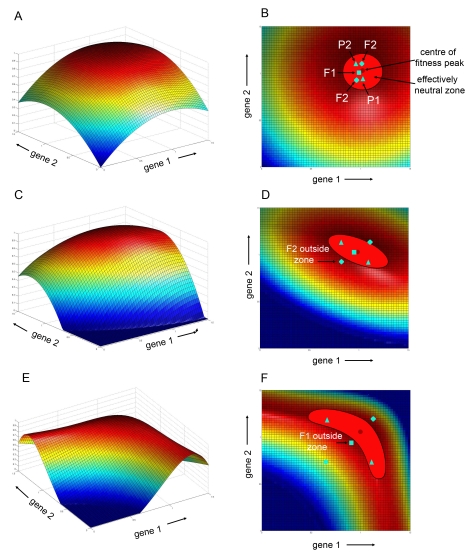
Crosses between closely related species give two contrasting results. One result is that species hybrids may be inferior to their parents, for example, being less fertile [1]. The other is that F1 hybrids may display superior performance (heterosis), for example with increased vigour [2]. Although various hypotheses have been proposed to account for these two aspects of hybridisation, their biological basis is still poorly understood [3]. To gain further insights into this issue, we analysed the role that variation in gene expression may play. We took a conserved trait, flower asymmetry in Antirrhinum, and determined the extent to which the underlying regulatory genes varied in expression among closely related species. We show that expression of both genes analysed, CYC and RAD, varies significantly between species because of cis-acting differences. By making a quantitative genotype-phenotype map, using a range of mutant alleles, we demonstrate that the species lie on a plateau in gene expression-morphology space, so that the variation has no detectable phenotypic effect. However, phenotypic differences can be revealed by shifting genotypes off the plateau through genetic crosses. Our results can be readily explained if genomes are free to evolve within an effectively neutral zone in gene expression space. The consequences of this drift will be negligible for individual loci, but when multiple loci across the genome are considered, we show that the variation may have significant effects on phenotype and fitness, causing a significant drift load. By considering these consequences for various gene-expression-fitness landscapes, we conclude that F1 hybrids might be expected to show increased performance with regard to conserved traits, such as basic physiology, but reduced performance with regard to others. Thus, our study provides a new way of explaining how various aspects of hybrid performance may arise through natural variation in gene activity.


Conflict of interest statement

The authors have declared that no competing interests exist.

Figures

Figure 1
Figure 1. Expression of CYC and RAD gene from various species relative to A. majus.
Significant differences in expression relative to the A. majus allele were observed among different species hybrids. Allele ratios in F1 hybrids with various species (spp) were obtained from competitive RT-PCR and pyrosequencing on cDNA from flower buds (stage 11). The species heterozygous with A. majus are: bra, A. braun-blanquetii; cha, A. charidemi; lat, A. latifolium; lin, A. linkianum; maj, A. majus; meo, A. meonanthum; pul, A. pulverulentum; str, A. striatum; tor, A. tortuosum. Expression levels were also obtained for heterozygotes carrying A. charidemi alleles in the A. majus background (cha-BC). Genomic DNA was used to calculate PCR amplification biases. Standard errors are shown.
Figure 2
Figure 2. Phenotype of flowers with various CYC and RAD genotypes.
Note that the double heterozygote (centre) has a notched phenotype, in which the lateral part of the flower is open. Genotypes A, B, and C were obtained by selfing a cyc heterozygote (genotype B). Genotypes C, F, and I were produced from selfing a rad heterozygote (genotype F). Genotypes C, E, and F were obtained by selfing the cyc rad double heterozygote (genotype E). Genotypes B and D were obtained by crossing the cyc mutant (genotype A) with the double heterozygote (genotype E). Genotypes F and H were obtained by crossing the rad mutant with the double heterozygote (genotype E). All plants were genotyped for wild-type and mutant alleles of CYC and RAD. Yellow dotted line highlights the opening between the upper and lower lobes, called “notch” phenotype.
Figure 3
Figure 3. Petal outlines and principal components used to define a dorsalisation index.
(A) The corolla template comprised 112 landmarks (primary landmarks in black), placed on the outlines of dorsal (dor), lateral (lat), and ventral (ven) lobes and on half of the tube (tub). (B) Effect of varying PC1cor values by ±1 standard deviation (SD) about the mean. The PC1cor value of −1 SD gives petal shapes similar to a fully ventralised flower while a value of +1 SD gives petal shapes more like wild type. (C) Effect of varying PC1lat by ±1 SD about the mean. PC1lat was based on variation in a 25-landmark template of the lateral lobe.
Figure 4
Figure 4. GEM spaces for CYC and RAD, showing location of various genotypes and species.
(A) Dorsalisation index for each position in GEM space using values from Table 1. Standard errors for DI cor and expression levels are shown (if error bars are not visible, they are smaller than the symbols). A smooth surface has been fitted to the data (see Materials and Methods for details of surface fitting). Note that the wild-type, C, lies on a plateau while the double heterozygote, E, is on the slope. (B) Top view of the GEM space, incorporating the relative expression values from the species taken from Figure 1 (circles). These values were adjusted assuming that A. majus (red circle) is at position (1, 1) in gene expression space. Triangles indicate expected gene activity values in the double heterozygote (CYC = x×0.6; RAD = y×0.5; see Table 1E). Some of the double heterozygotes are predicted to have DI values above or below the position of A. majus. Triangles pointing upwards indicate species showing notch phenotype. (C) Enlargement of rectangle in (B). bra, A. braun-blanquetii; cha, A. charidemi; lat, A. latifolium; lin, A. linkianum; maj, A. majus; meo, A. meonanthum; pul, A. pulverulentum; str, A. striatum; tor, A. tortuosum; cha-BC, introgression of A. charidemi into A. majus background.
Figure 5
Figure 5. Phenotypes and DI values for introgressed lines.
(A and B) Segregating phenotypes obtained from crossing CYCmajRADmaj/CYCchaRADcha to the double mutant cyc rad/cyc rad. Yellow dotted line shows where the rims of the lateral and dorsal tube meet and highlights the difference between the effect of A. charidemi alleles (left) and those of A. majus (right). (C) DI cor values for the genotypes in (A and B). Note that the A. charidemi alleles give a higher DI cor value than the A. majus alleles (two-sided t-test 114.87df = 7.24, p<0.001). (D) DI lat values for progeny obtained from CYCmajRADmaj/CYCchaRADcha crossed to the double mutant cyc rad/cyc rad. The A. charidemi alleles give a higher DI lat value than the A. majus alleles (two-sided unpaired t-test 508df = 6.73, p<0.001). (E) DI lat values for progeny from a plant heterozygous for a recombinant allele (CYCmajRADmaj/CYCchaRADmaj) crossed to the double mutant cyc rad/cyc rad. Plants carrying the CYCcha allele have a higher DI lat value than those carrying the CYCmaj (two-sided t-test 202.37df = 3.14, p = 0.002). (F) DI lat values for progeny from a plant heterozygous for a recombinant allele (CYCmajRADmaj/CYCmajRADcha) crossed to the double mutant cyc rad/cyc rad. Plants carrying the RADcha allele are not significantly different from those carrying RADmaj (two-sided t-test 202.37df = 3.14, p = 0.002). Bars indicate standard errors.
Figure 6
Figure 6. Expression ratios of A. charidemi alleles in various genetic backgrounds.
(A and B) Ratios of CYCcha expression relative to CYCmaj for BC6 (A) and F1 hybrids (B) at various developmental stages. The CYCcha allele is expressed at a higher level than CYCmaj at all stages. (C and D) Ratios of RADcha expression relative to RADmaj for BC6 (A) and F1 hybrids (B) at various developmental stages. RADcha expression was higher than RADmaj only at the earliest developmental stage analysed. Genomic DNA (white circles) was used to calculate PCR amplification biases. Bars, standard error.
Figure 7
Figure 7. GEF spaces.
Gene expression levels for two genes are plotted along the horizontal plane while fitness is along the vertical axis. (A) Radially symmetrical peak. (B) 2-D Projection of (A) showing location of effectively neutral zone and position of two parental genotypes (P1, P2 triangles), the resulting F1 (square) and additional genotypes observed in the F2 (diamonds). The F1 in this case is nearer to the centre of the peak while the F2s have similar fitness to the parents. (C) Diagonal ridge. (D) 2-D projection of diagonal ridge showing tilted elliptical neutral zone. The F1 is nearer to the peak than the parents but some F2 genotypes may now have lower fitness and fall outside the neutral zone. (E) Curved ridge. (F) 2-D projection of curved ridge showing banana-shaped neutral zone. Some F1 genotypes may have lower fitness and fall outside the neutral zone.

Comment in

References

    1. Orr H. A, Presgraves D. C. Speciation by postzygotic isolation: forces, genes and molecules. Bioessays. 2000;22:1085–1094. - PubMed
    1. Birchler J. A, Auger D. L, Riddle N. C. In search of the molecular basis of heterosis. Plant Cell. 2003;15:2236–2239. - PMC - PubMed
    1. Burke J. M, Arnold M. L. Genetics and the Fitness of Hybrids. Annu Rev Genet. 2001;35:31–52. - PubMed
    1. Chen Z. J. Molecular mechanisms of polyploidy and hybrid vigor. Trends Plant Sci. 2009;15:57–71. - PMC - PubMed
    1. Bateson W. Heredity and variation in modern lights. In: Seward A. C, editor. Darwin and modern science. Cambridge: Cambridge University Press; 1909.

Publication types