

Targeting intrinsically disordered proteins in neurodegenerative and protein dysfunction diseases: another illustration of the D(2) concept
- PMID: 20653509
- PMCID: PMC3371274
- DOI: 10.1586/epr.10.36
Targeting intrinsically disordered proteins in neurodegenerative and protein dysfunction diseases: another illustration of the D(2) concept
Abstract
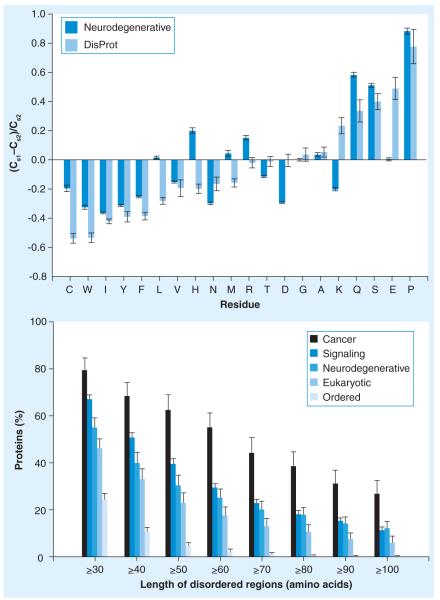
Many biologically active proteins, which are usually called intrinsically disordered or natively unfolded proteins, lack stable tertiary and/or secondary structure under physiological conditions in vitro. Their functions complement the functional repertoire of ordered proteins, with intrinsically disordered proteins (IDPs) often being involved in regulation, signaling and control. Their amino acid sequences and compositions are very different from those of ordered proteins, making reliable identification of IDPs possible at the proteome level. IDPs are highly abundant in various human diseases, including neurodegeneration and other protein dysfunction maladies and, therefore, represent attractive novel drug targets. Some of the aspects of IDPs, as well as their roles in neurodegeneration and protein dysfunction diseases, are discussed in this article, together with the peculiarities of IDPs as potential drug targets.
Figures
Similar articles
-
The mysterious unfoldome: structureless, underappreciated, yet vital part of any given proteome.J Biomed Biotechnol. 2010;2010:568068. doi: 10.1155/2010/568068. J Biomed Biotechnol. 2010. PMID: 20011072 Free PMC article. Review.
-
Proteins without unique 3D structures: biotechnological applications of intrinsically unstable/disordered proteins.Biotechnol J. 2015 Mar;10(3):356-66. doi: 10.1002/biot.201400374. Epub 2014 Oct 6. Biotechnol J. 2015. PMID: 25287424 Review.
-
How to drug a cloud? Targeting intrinsically disordered proteins.Pharmacol Rev. 2024 Oct 21:PHARMREV-AR-2023-001113. doi: 10.1124/pharmrev.124.001113. Online ahead of print. Pharmacol Rev. 2024. PMID: 39433443
-
Intrinsically disordered proteins and structured proteins with intrinsically disordered regions have different functional roles in the cell.PLoS One. 2019 Aug 19;14(8):e0217889. doi: 10.1371/journal.pone.0217889. eCollection 2019. PLoS One. 2019. PMID: 31425549 Free PMC article.
-
Intrinsically disordered proteins in human diseases: introducing the D2 concept.Annu Rev Biophys. 2008;37:215-46. doi: 10.1146/annurev.biophys.37.032807.125924. Annu Rev Biophys. 2008. PMID: 18573080 Review.
Cited by
-
Folding or holding?-Hsp70 and Hsp90 chaperoning of misfolded proteins in neurodegenerative disease.J Biol Chem. 2022 May;298(5):101905. doi: 10.1016/j.jbc.2022.101905. Epub 2022 Apr 6. J Biol Chem. 2022. PMID: 35398094 Free PMC article. Review.
-
The dark side of Alzheimer's disease: unstructured biology of proteins from the amyloid cascade signaling pathway.Cell Mol Life Sci. 2020 Oct;77(20):4163-4208. doi: 10.1007/s00018-019-03414-9. Epub 2020 Jan 2. Cell Mol Life Sci. 2020. PMID: 31894361 Free PMC article.
-
Staphylococcus epidermidis small basic protein (Sbp) forms amyloid fibrils, consistent with its function as a scaffolding protein in biofilms.J Biol Chem. 2018 Sep 14;293(37):14296-14311. doi: 10.1074/jbc.RA118.002448. Epub 2018 Jul 26. J Biol Chem. 2018. PMID: 30049797 Free PMC article.
-
Chaotic aging: intrinsically disordered proteins in aging-related processes.Cell Mol Life Sci. 2023 Aug 27;80(9):269. doi: 10.1007/s00018-023-04897-3. Cell Mol Life Sci. 2023. PMID: 37634152 Free PMC article.
-
Classification of Complete Proteomes of Different Organisms and Protein Sets Based on Their Protein Distributions in Terms of Some Key Attributes of Proteins.Int J Genomics. 2018 Mar 4;2018:9784161. doi: 10.1155/2018/9784161. eCollection 2018. Int J Genomics. 2018. PMID: 29686995 Free PMC article.
References
-
- Fischer E. Einfluss der configuration auf die wirkung der enzyme. Ber. Dt. Chem. Ges. 1894;27:2985–2993.
-
- Lemieux UR, Spohr U. How Emil Fischer was led to the lock and key concept for enzyme specificity. Adv. Carbohydrate Chem. Biochem. 1994;50:1–20. - PubMed
-
-
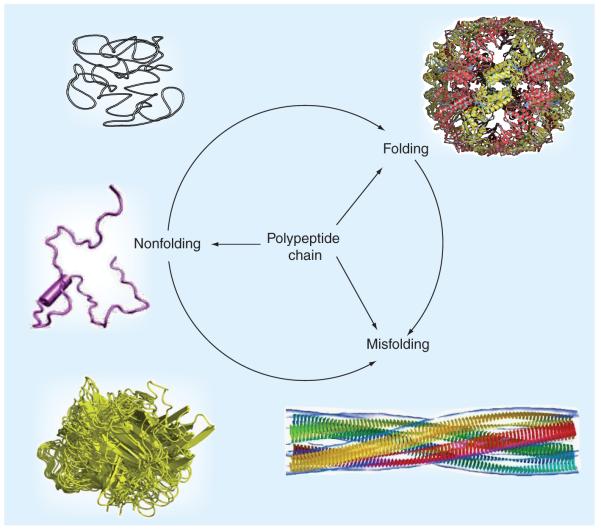
Dobson CM. Protein misfolding, evolution and disease. Trends Biochem. Sci. 1999;24(9):329–332. • Provides a comprehensive overview of the protein-misfolding phenomenon and links misfolding with protein evolution and pathogenesis of conformational diseases.
-
-
- Daughdrill GW, Pielak GJ, Uversky VN, Cortese MS, Dunker AK. Natively disordered proteins. In: Buchner J, Kiefhaber T, editors. Handbook of Protein Folding. Wiley-VCH, Verlag GmbH & Co.; Weinheim, Germany: 2005. pp. 271–353.
Publication types
MeSH terms
Substances
Grants and funding
LinkOut - more resources
Full Text Sources