

Toxicodynamic effects of ciclosporin are reflected by metabolite profiles in the urine of healthy individuals after a single dose
- PMID: 20653677
- PMCID: PMC2911554
- DOI: 10.1111/j.1365-2125.2010.03689.x
Toxicodynamic effects of ciclosporin are reflected by metabolite profiles in the urine of healthy individuals after a single dose
Abstract
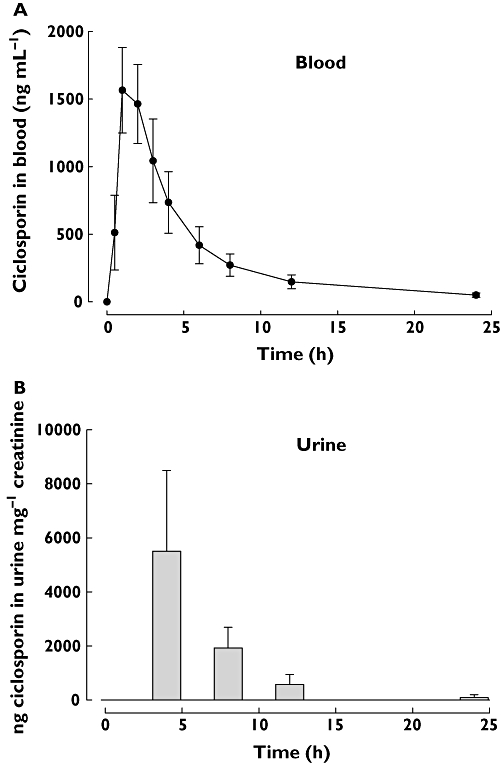
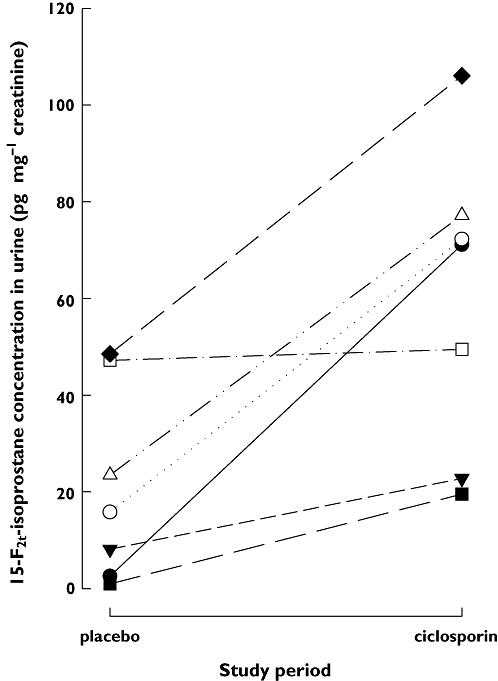
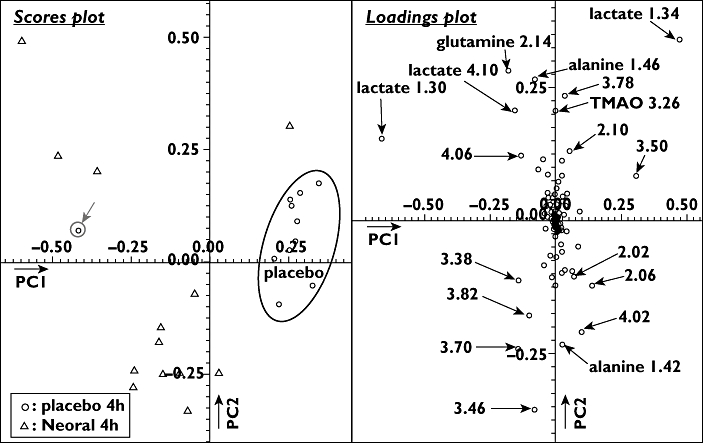
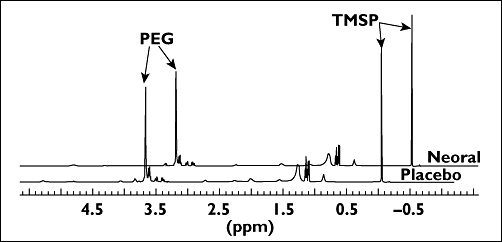
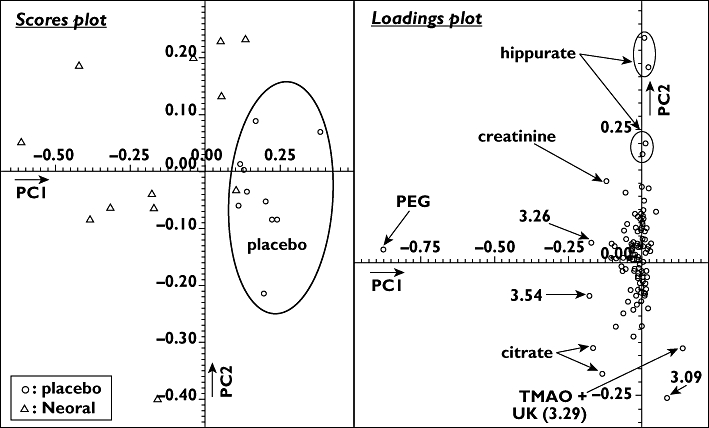
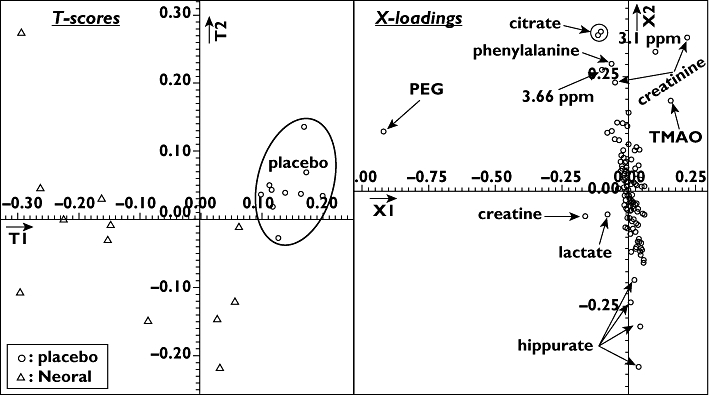
WHAT IS ALREADY KNOWN ABOUT THE SUBJECT * Ciclosporin's nephrotoxicity initially targets the proximal tubule and is, at least in part, driven by increased formation of oxygen radicals. * (1)H-nuclear magnetic resonance spectroscopy (NMR)- and mass spectrometry (MS)-based biochemical profiling (metabolomics) allows for the sensitive detection of metabolite pattern changes in urine. * In systematic studies in rats we showed that ciclosporin caused urine metabolite pattern changes typical for proximal tubule damage and that these pattern changes seemed to be more sensitive than established clinical kidney function markers such as serum creatinine concentrations. WHAT THIS PAPER ADDS * This study showed that urine metabolite pattern changes as assessed by (1)H-NMR and HPLC-MS are sensitive enough to detect the effect of ciclosporin as early as 4 h after a single oral dose. * In our previous rat studies, changes in urine metabolite pattern in response to ciclosporin translated into healthy humans, indicating the involvement of the same toxicodynamic mechanisms. * The results provide proof of concept for further development of this combination molecular marker strategy into diagnostic tools for the detection and monitoring of drug nephrotoxicity. AIMS The immunosuppressant ciclosporin is an efficient prophylaxis against transplant organ rejection but its clinical use is limited by its nephrotoxicity. Our previous systematic studies in the rat indicated urine metabolite pattern changes to be sensitive indicators of the negative effects of ciclosporin on the kidney. To translate these results, we conducted an open label, placebo-controlled, crossover study assessing the time-dependent toxicodynamic effects of a single oral ciclosporin dose (5 mg kg(-1)) on the kidney in 13 healthy individuals. METHODS In plasma and urine samples, ciclosporin and 15-F(2t)-isoprostane concentrations were assessed using HPLC-MS and metabolite profiles using (1)H-NMR spectroscopy. RESULTS The maximum ciclosporin concentrations were 1489 +/- 425 ng ml(-1) (blood) and 2629 +/- 1308 ng ml(-1) (urine). The increase in urinary 15-F(2t)-isoprostane observed 4 h after administration of ciclosporin indicated an increase in oxidative stress. 15-F(2t)-isoprostane concentrations were on average 2.9-fold higher after ciclosporin than after placebo (59.8 +/- 31.2 vs. 20.9 +/- 19.9 pg mg(-1) creatinine, P < 0.02). While there were no conclusive changes in plasma 15-F(2t)-isoprostane concentrations or metabolite patterns, non-targeted metabolome analysis using principal components analysis and partial least square fit analysis revealed significant changes in urine metabolites typically associated with negative effects on proximal tubule cells. The major metabolites that differed between the 4 h urine samples after ciclosporin and placebo were citrate, hippurate, lactate, TMAO, creatinine and phenylalanine. CONCLUSION Changes in urine metabolite patterns as a molecular marker are sufficiently sensitive for the detection of the negative effects of ciclosporin on the kidney after a single oral dose.
Figures
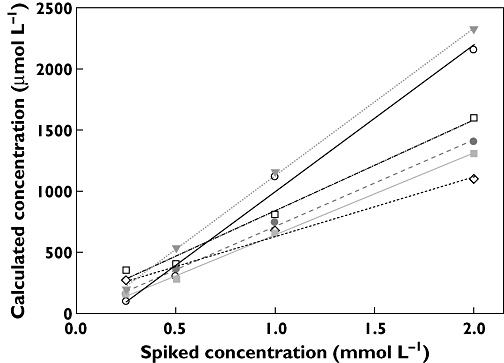
 ); Glu (
 ); lactate (
 ); creatinine (
 ); citrate (
 ); TMAO (
 )
)
Similar articles
-
Metabolic profiles in urine reflect nephrotoxicity of sirolimus and cyclosporine following rat kidney transplantation.Nephron Exp Nephrol. 2009;111(4):e80-91. doi: 10.1159/000209208. Epub 2009 Mar 17. Nephron Exp Nephrol. 2009. PMID: 19293597
-
Urine metabolites reflect time-dependent effects of cyclosporine and sirolimus on rat kidney function.Chem Res Toxicol. 2009 Jan;22(1):118-28. doi: 10.1021/tx800253x. Chem Res Toxicol. 2009. PMID: 19099400 Free PMC article.
-
Everolimus and sirolimus in combination with cyclosporine have different effects on renal metabolism in the rat.PLoS One. 2012;7(10):e48063. doi: 10.1371/journal.pone.0048063. Epub 2012 Oct 31. PLoS One. 2012. PMID: 23118926 Free PMC article.
-
Toxicodynamic therapeutic drug monitoring of immunosuppressants: promises, reality, and challenges.Ther Drug Monit. 2008 Apr;30(2):151-8. doi: 10.1097/FTD.0b013e31816b9063. Ther Drug Monit. 2008. PMID: 18367974 Review.
-
Effect of CYP3A and ABCB1 single nucleotide polymorphisms on the pharmacokinetics and pharmacodynamics of calcineurin inhibitors: Part II.Clin Pharmacokinet. 2010 Apr;49(4):207-21. doi: 10.2165/11317550-000000000-00000. Clin Pharmacokinet. 2010. PMID: 20214406 Review.
Cited by
-
Biomarkers of immunosuppressant organ toxicity after transplantation: status, concepts and misconceptions.Expert Opin Drug Metab Toxicol. 2011 Feb;7(2):175-200. doi: 10.1517/17425255.2011.544249. Expert Opin Drug Metab Toxicol. 2011. PMID: 21241200 Free PMC article. Review.
-
Metabolomics of oxidative stress in recent studies of endogenous and exogenously administered intermediate metabolites.Int J Mol Sci. 2011;12(10):6469-501. doi: 10.3390/ijms12106469. Epub 2011 Sep 28. Int J Mol Sci. 2011. PMID: 22072900 Free PMC article. Review.
-
The impact of p53 on aristolochic acid I-induced nephrotoxicity and DNA damage in vivo and in vitro.Arch Toxicol. 2019 Nov;93(11):3345-3366. doi: 10.1007/s00204-019-02578-4. Epub 2019 Oct 10. Arch Toxicol. 2019. PMID: 31602497 Free PMC article.
-
Urine metabolomics insight into acute kidney injury point to oxidative stress disruptions in energy generation and H2S availability.J Mol Med (Berl). 2017 Dec;95(12):1399-1409. doi: 10.1007/s00109-017-1594-5. Epub 2017 Oct 4. J Mol Med (Berl). 2017. PMID: 28975359
-
Proteomics and metabolomics in renal transplantation-quo vadis?Transpl Int. 2013 Mar;26(3):225-41. doi: 10.1111/tri.12003. Epub 2012 Nov 21. Transpl Int. 2013. PMID: 23350848 Free PMC article. Review.
References
-
- Hariharan S, Johnson CP, Bresnahan BA, Taranto SE, McIntosh MJ, Stablein D. Improved graft survival after renal transplantation in the United States, 1988 to 1996. N Engl J Med. 2000;342:605–12. - PubMed
-
- Berl T. American Society of Nephrology Renal Research Report. J Am Soc Nephrol. 2005;16:1886–903. - PubMed
-
- Wong W, Venetz JP, Tolkoff-Rubin N, Pascual M. Immunosuppressive strategies in kidney transplantation: which role for the calcineurin inhibitors? Transplantation. 2005;80:289–96. - PubMed
-
- Taylor AL, Watson CJ, Bradley JA. Immunosuppressive agents in solid organ transplantation: mechanisms of action and therapeutic efficacy. Crit Rev Oncol Hematol. 2005;56:23–46. - PubMed
Publication types
MeSH terms
Substances
Grants and funding
LinkOut - more resources
Full Text Sources
