. 2010 Jul 23:11:396.
doi: 10.1186/1471-2105-11-396.

Application of machine learning methods to histone methylation ChIP-Seq data reveals H4R3me2 globally represses gene expression

Affiliations

Application of machine learning methods to histone methylation ChIP-Seq data reveals H4R3me2 globally represses gene expression

Xiaojiang Xu et al. BMC Bioinformatics. .

Abstract

Background: In the last decade, biochemical studies have revealed that epigenetic modifications including histone modifications, histone variants and DNA methylation form a complex network that regulate the state of chromatin and processes that depend on it including transcription and DNA replication. Currently, a large number of these epigenetic modifications are being mapped in a variety of cell lines at different stages of development using high throughput sequencing by members of the ENCODE consortium, the NIH Roadmap Epigenomics Program and the Human Epigenome Project. An extremely promising and underexplored area of research is the application of machine learning methods, which are designed to construct predictive network models, to these large-scale epigenomic data sets.

Results: Using a ChIP-Seq data set of 20 histone lysine and arginine methylations and histone variant H2A.Z in human CD4+ T-cells, we built predictive models of gene expression as a function of histone modification/variant levels using Multilinear (ML) Regression and Multivariate Adaptive Regression Splines (MARS). Along with extensive crosstalk among the 20 histone methylations, we found H4R3me2 was the most and second most globally repressive histone methylation among the 20 studied in the ML and MARS models, respectively. In support of our finding, a number of experimental studies show that PRMT5-catalyzed symmetric dimethylation of H4R3 is associated with repression of gene expression. This includes a recent study, which demonstrated that H4R3me2 is required for DNMT3A-mediated DNA methylation--a known global repressor of gene expression.

Conclusion: In stark contrast to univariate analysis of the relationship between H4R3me2 and gene expression levels, our study showed that the regulatory role of some modifications like H4R3me2 is masked by confounding variables, but can be elucidated by multivariate/systems-level approaches.


Figures

Figure 1
Figure 1
Flowchart of multilinear and MARS model construction. Chart describes the analysis steps in model construction. Starting with histone mark/variant ChIP-Seq data, template profile and amplitude calculation, and finally construction of regression models using mark amplitudes as inputs and log2 gene expression as outputs.
Figure 2
Figure 2
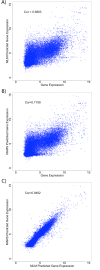
Comparison of predicted and observed gene expression. Scatter plots of (A) the multilinear model (MLM) predicted gene expression versus observed gene expression; (B) the MARS predicted gene expression versus observed gene expression; and (C) the MARS predicted gene expression versus multilinear model predicted gene expression. The corresponding Pearson correlation coefficient is shown within each plot.
Figure 3
Figure 3
Gene expression heat maps. Heat maps of gene expression (color scale) as a function of bivalent (y-axis) and monovalent (x-axis) enrichment amplitudes for (A) H3K27me2-H3K36me3 versus H3K27me3 and (B) H3K36me3-H4R3me2 versus H4R3me2. The y-axis represents the product of the amplitudes of both marks and the x-axis represents one component of the pair. Gene expression values were binned into a 10,000 square grid with level represented by color. Vertical lines represent a constant value of the x-axis mark amplitude (i.e., H3K27me2 in (A) and H4R3me2 in (B)), while a line emanating from the origin represents a constant value of H3K36me3 in (A) and (B) with the slope corresponding to H3K36me3 level. Plot (A) shows mark avoidance, as there are few genes with high levels of both marks while (B) shows a trend toward mark concurrence. These plots also demonstrate how H3K36me3 strongly overrides H4R3me2 (increasing radial slope corresponds to increasing gene expression in (B)) but has more difficulty overriding the repressive activity of H3K27me2.
Figure 4
Figure 4
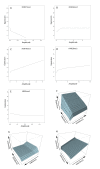
MARS response plots. Predicted gene expression versus amplitude for either one (2 D plots) or two marks (3 D plots) for (A) H3K27me2 (B) H3K36me3 (C) H3K79me3 (D) H4K20me1 (E) H4R3me2 (F) H4K20me1-H3K36me3 (G) H3K36me3-H4R3me2 and (H) H3K79me1-H3K79me3. Each axis represents the full range of expression and amplitude values. The trend of plots represents activating (positive slope) or repressive (negative slope) behavior. Many individual marks (A)-(E) and pairs (F)-(H) show some saturation effects and nonlinear behavior that could not be captured with a linear model; H3K36me3 (B), H4K20me1 (D) and H4R3me2 (E) show particularly distinct saturation effects. The combination H4K20me1-H3K36me3 (F) shows a dramatic nonlinear, synergistic activating effect. In contrast, the two marks in the combination H3K36me3-H4R3me2 (G) show opposing effects in that H3K36me3 activates and H4R3me2 represses gene expression.
Figure 5
Figure 5
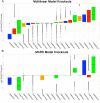
Box plots of MLM and MARS knockouts. Box plots representing the predicted log2 fold change (WT/KO) in gene expression after knocking out (setting mark amplitude to zero) a single mark while holding all other amplitudes at their experimental values in both the multilinear (A) and MARS (B) models. Negative shifts indicate repressive marks and positive shifts indicate activating marks. Both models show general agreement in knockout effects. Interestingly, both models choose H4R3me2 to be among the most globally repressive marks, whereas previous studies comparing H4R3me2 levels to gene expression have shown little to no correlation, suggesting the repressive character of H4R3me2 becomes apparent in a multivariate analysis of multiple modifications.
Figure 6
Figure 6
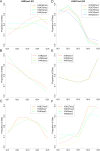
Enriched sites across MLM knockout quintiles. Plots show the proportion of significantly enriched sites identified by MACS (y-axis) for marks shown in the legend across the data divided by quintiles of log2 fold change (WT/KO) in gene expression predicted by the MLM for H4R3me2, (A)-(C), and H3K27me2, (D)-(F), knockouts. Proportions of sites were clustered using k-means clustering. For both knockouts activating marks clustered together, (A) and (D), as did arginine methylations, (B) and (E), and repressive marks, (C) and (F). H4R3me2 knockout effect only shows a strong correlation with other arginine methylations (B), while the H3K27me3 knockout effect shows strong anti-correlation with the activating marks (A) and strong positive correlation with other repressive marks (F).

References

    1. Li B, Carey M, Workman JL. The role of chromatin during transcription. Cell. 2007;128(4):707–719. doi: 10.1016/j.cell.2007.01.015. - DOI - PubMed
    1. Berger SL. The complex language of chromatin regulation during transcription. Nature. 2007;447(7143):407–412. doi: 10.1038/nature05915. - DOI - PubMed
    1. Ruthenburg AJ, Li H, Patel DJ, Allis CD. Multivalent engagement of chromatin modifications by linked binding modules. Nat Rev Mol Cell Biol. 2007;8(12):983–994. doi: 10.1038/nrm2298. - DOI - PMC - PubMed
    1. Strahl BD, Allis CD. The language of covalent histone modifications. Nature. 2000;403(6765):41–45. doi: 10.1038/47412. - DOI - PubMed
    1. Jenuwein T, Allis CD. Translating the histone code. Science. 2001;293(5532):1074–1080. doi: 10.1126/science.1063127. - DOI - PubMed

Publication types