

Evolutionary divergence in the fungal response to fluconazole revealed by soft clustering
- PMID: 20653936
- PMCID: PMC2926788
- DOI: 10.1186/gb-2010-11-7-r77
Evolutionary divergence in the fungal response to fluconazole revealed by soft clustering
Abstract
Background: Fungal infections are an emerging health risk, especially those involving yeast that are resistant to antifungal agents. To understand the range of mechanisms by which yeasts can respond to anti-fungals, we compared gene expression patterns across three evolutionarily distant species - Saccharomyces cerevisiae, Candida glabrata and Kluyveromyces lactis - over time following fluconazole exposure.
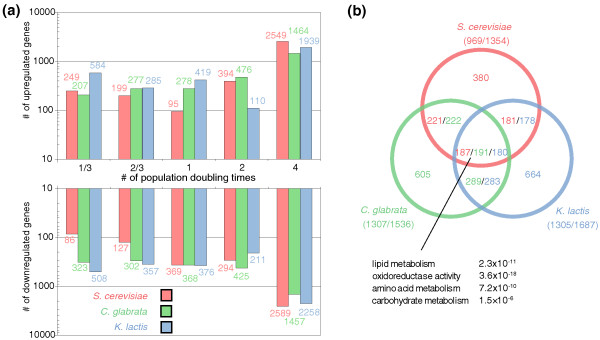
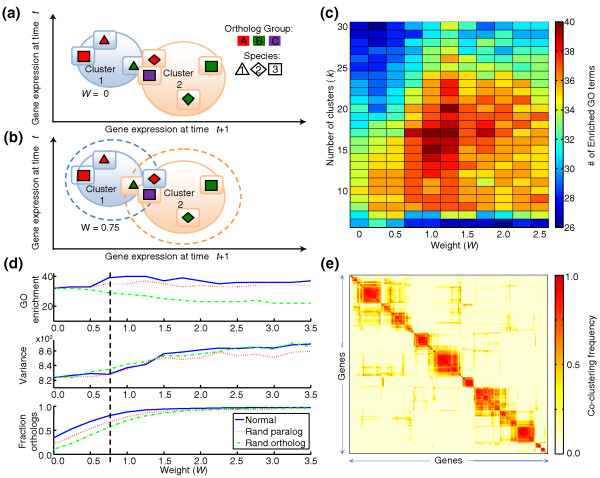
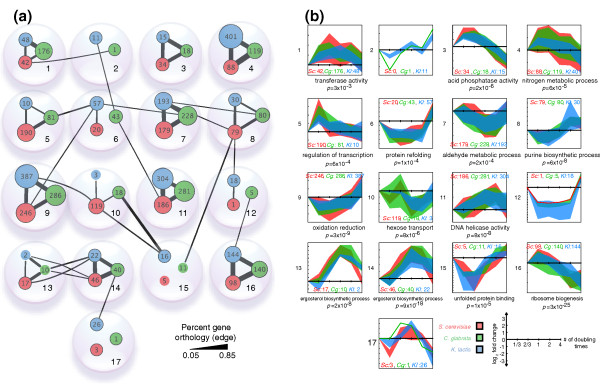
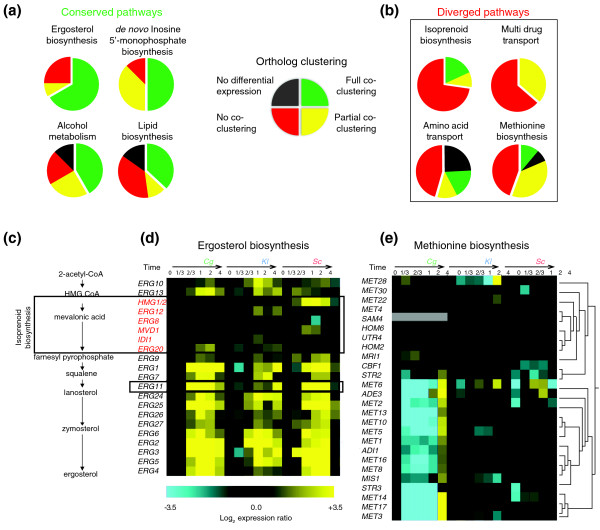
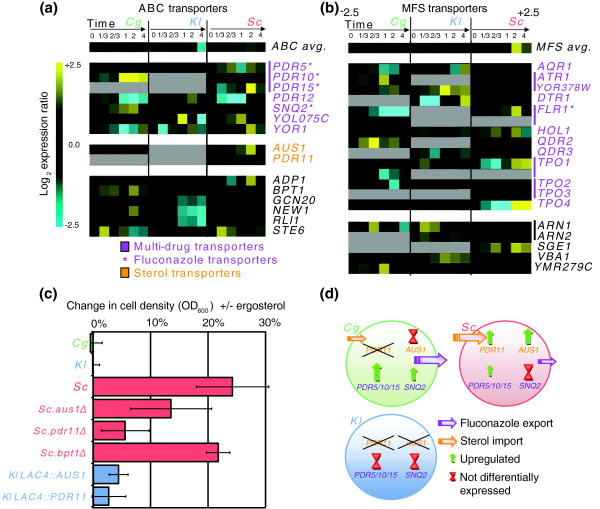
Results: Conserved and diverged expression patterns were identified using a novel soft clustering algorithm that concurrently clusters data from all species while incorporating sequence orthology. The analysis suggests complementary strategies for coping with ergosterol depletion by azoles - Saccharomyces imports exogenous ergosterol, Candida exports fluconazole, while Kluyveromyces does neither, leading to extreme sensitivity. In support of this hypothesis we find that only Saccharomyces becomes more azole resistant in ergosterol-supplemented media; that this depends on sterol importers Aus1 and Pdr11; and that transgenic expression of sterol importers in Kluyveromyces alleviates its drug sensitivity.
Conclusions: We have compared the dynamic transcriptional responses of three diverse yeast species to fluconazole treatment using a novel clustering algorithm. This approach revealed significant divergence among regulatory programs associated with fluconazole sensitivity. In future, such approaches might be used to survey a wider range of species, drug concentrations and stimuli to reveal conserved and divergent molecular response pathways.
Figures
Similar articles
-
Cyclic AMP signaling pathway modulates susceptibility of candida species and Saccharomyces cerevisiae to antifungal azoles and other sterol biosynthesis inhibitors.Antimicrob Agents Chemother. 2003 Oct;47(10):3195-201. doi: 10.1128/AAC.47.10.3195-3201.2003. Antimicrob Agents Chemother. 2003. PMID: 14506030 Free PMC article.
-
Genome-wide expression profiling reveals genes associated with amphotericin B and fluconazole resistance in experimentally induced antifungal resistant isolates of Candida albicans.J Antimicrob Chemother. 2004 Aug;54(2):376-85. doi: 10.1093/jac/dkh336. Epub 2004 Jun 16. J Antimicrob Chemother. 2004. PMID: 15201233
-
The Candida glabrata putative sterol transporter gene CgAUS1 protects cells against azoles in the presence of serum.J Antimicrob Chemother. 2007 Dec;60(6):1264-72. doi: 10.1093/jac/dkm321. Epub 2007 Oct 2. J Antimicrob Chemother. 2007. PMID: 17913716
-
Resistance in human pathogenic yeasts and filamentous fungi: prevalence, underlying molecular mechanisms and link to the use of antifungals in humans and the environment.Dan Med J. 2016 Oct;63(10):B5288. Dan Med J. 2016. PMID: 27697142 Review.
-
Candida and candidaemia. Susceptibility and epidemiology.Dan Med J. 2013 Nov;60(11):B4698. Dan Med J. 2013. PMID: 24192246 Review.
Cited by
-
Comparative Transcriptomics Highlights New Features of the Iron Starvation Response in the Human Pathogen Candida glabrata.Front Microbiol. 2018 Nov 16;9:2689. doi: 10.3389/fmicb.2018.02689. eCollection 2018. Front Microbiol. 2018. PMID: 30505294 Free PMC article.
-
A Network of Paralogous Stress Response Transcription Factors in the Human Pathogen Candida glabrata.Front Microbiol. 2016 May 9;7:645. doi: 10.3389/fmicb.2016.00645. eCollection 2016. Front Microbiol. 2016. PMID: 27242683 Free PMC article.
-
Matching experiments across species using expression values and textual information.Bioinformatics. 2012 Jun 15;28(12):i258-64. doi: 10.1093/bioinformatics/bts205. Bioinformatics. 2012. PMID: 22689770 Free PMC article.
-
ModuleBlast: identifying activated sub-networks within and across species.Nucleic Acids Res. 2015 Feb 18;43(3):e20. doi: 10.1093/nar/gku1224. Epub 2014 Nov 26. Nucleic Acids Res. 2015. PMID: 25428368 Free PMC article.
-
Otilonium Bromide Exhibits Potent Antifungal Effects by Blocking Ergosterol Plasma Membrane Localization and Triggering Cytotoxic Autophagy in Candida Albicans.Adv Sci (Weinh). 2024 Sep;11(35):e2406473. doi: 10.1002/advs.202406473. Epub 2024 Jul 12. Adv Sci (Weinh). 2024. PMID: 38995235 Free PMC article.
References
-
- Sanguinetti M, Posteraro B, Fiori B, Ranno S, Torelli R, Fadda G. Mechanisms of azole resistance in clinical isolates of Candida glabrata collected during a hospital survey of antifungal resistance. Antimicrob Agents Chemother. 2005;49:668–679. doi: 10.1128/AAC.49.2.668-679.2005. - DOI - PMC - PubMed
Publication types
MeSH terms
Substances
Associated data
- Actions
Grants and funding
LinkOut - more resources
Full Text Sources
Medical
Molecular Biology Databases
