A yeast-based genomic strategy highlights the cell protein networks altered by FTase inhibitor peptidomimetics
- PMID: 20653956
- PMCID: PMC2925370
- DOI: 10.1186/1476-4598-9-197
A yeast-based genomic strategy highlights the cell protein networks altered by FTase inhibitor peptidomimetics
Abstract
Background: Farnesyltransferase inhibitors (FTIs) are anticancer agents developed to inhibit Ras oncoprotein activities. FTIs of different chemical structure act via a conserved mechanism in eukaryotic cells. They have low toxicity and are active on a wide range of tumors in cellular and animal models, independently of the Ras activation state. Their ultimate mechanism of action, however, remains undetermined. FTase has hundred of substrates in human cells, many of which play a pivotal role in either tumorigenesis or in pro-survival pathways. This lack of knowledge probably accounts for the failure of FTIs at clinical stage III for most of the malignancies treated, with the notable exception of haematological malignancies. Understanding which cellular pathways are the ultimate targets of FTIs in different tumor types and the basis of FTI resistance is required to improve the efficacy of FTIs in cancer treatment.
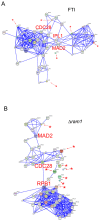
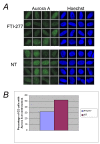
Results: Here we used a yeast-based cellular assay to define the transcriptional changes consequent to FTI peptidomimetic administration in conditions that do not substantially change Ras membrane/cytosol distribution. Yeast and cancer cell lines were used to validate the results of the network analysis. The transcriptome of yeast cells treated with FTase inhibitor I was compared with that of untreated cells and with an isogenic strain genetically inhibited for FTase activity (Deltaram1). Cells treated with GGTI-298 were analyzed in a parallel study to validate the specificity of the FTI response. Network analysis, based on gene ontology criteria, identified a cell cycle gene cluster up-regulated by FTI treatment that has the Aurora A kinase IPL1 and the checkpoint protein MAD2 as hubs. Moreover, TORC1-S6K-downstream effectors were found to be down-regulated in yeast and mammalian FTI-treated cells. Notably only FTIs, but not genetic inhibition of FTase, elicited up-regulation of ABC/transporters.
Conclusions: This work provides a view of how FTIs globally affect cell activity. It suggests that the chromosome segregation machinery and Aurora A association with the kinetochore as well as TORC1-S6K downstream effectors are among the ultimate targets affected by the transcriptional deregulation caused by FTI peptidomimetics. Moreover, it stresses the importance of monitoring the MDR response in patients treated with FTIs.
Figures


Similar articles
-
Combined p21-activated kinase and farnesyltransferase inhibitor treatment exhibits enhanced anti-proliferative activity on melanoma, colon and lung cancer cell lines.Mol Cancer. 2013 Aug 6;12(1):88. doi: 10.1186/1476-4598-12-88. Mol Cancer. 2013. PMID: 23915247 Free PMC article.
-
Inhibition of the prenylation of K-Ras, but not H- or N-Ras, is highly resistant to CAAX peptidomimetics and requires both a farnesyltransferase and a geranylgeranyltransferase I inhibitor in human tumor cell lines.Oncogene. 1997 Sep;15(11):1283-8. doi: 10.1038/sj.onc.1201296. Oncogene. 1997. PMID: 9315095
-
Evaluation of farnesyl:protein transferase and geranylgeranyl:protein transferase inhibitor combinations in preclinical models.Cancer Res. 2001 Dec 15;61(24):8758-68. Cancer Res. 2001. PMID: 11751396
-
Farnesyltransferase and geranylgeranyltransferase I inhibitors and cancer therapy: lessons from mechanism and bench-to-bedside translational studies.Oncogene. 2000 Dec 27;19(56):6584-93. doi: 10.1038/sj.onc.1204146. Oncogene. 2000. PMID: 11426643 Review.
-
Recent advances in understanding the antineoplastic mechanisms of farnesyltransferase inhibitors.Cancer Res. 2005 Oct 15;65(20):9109-12. doi: 10.1158/0008-5472.CAN-05-2635. Cancer Res. 2005. PMID: 16230362 Review.
Cited by
-
Aurora kinase A interacts with H-Ras and potentiates Ras-MAPK signaling.Oncotarget. 2017 Apr 25;8(17):28359-28372. doi: 10.18632/oncotarget.15049. Oncotarget. 2017. PMID: 28177880 Free PMC article.
-
Combined p21-activated kinase and farnesyltransferase inhibitor treatment exhibits enhanced anti-proliferative activity on melanoma, colon and lung cancer cell lines.Mol Cancer. 2013 Aug 6;12(1):88. doi: 10.1186/1476-4598-12-88. Mol Cancer. 2013. PMID: 23915247 Free PMC article.
-
Protein prenylation: enzymes, therapeutics, and biotechnology applications.ACS Chem Biol. 2015 Jan 16;10(1):51-62. doi: 10.1021/cb500791f. Epub 2014 Dec 8. ACS Chem Biol. 2015. PMID: 25402849 Free PMC article. Review.
-
Towards the systematic mapping and engineering of the protein prenylation machinery in Saccharomyces cerevisiae.PLoS One. 2015 Mar 13;10(3):e0120716. doi: 10.1371/journal.pone.0120716. eCollection 2015. PLoS One. 2015. PMID: 25768003 Free PMC article.
-
RAS signaling and immune cells: a sinister crosstalk in the tumor microenvironment.J Transl Med. 2023 Sep 5;21(1):595. doi: 10.1186/s12967-023-04486-9. J Transl Med. 2023. PMID: 37670322 Free PMC article. Review.
References
-
- Tamanoi F, Mitsuzawa H. Use of yeast for identification of farnesyltransferase inhibitors and for generation of mutant farnesyltransferases. Methods Enzymol. 1995;255:82–91. full_text. - PubMed
-
- Adjei AA. Farnesyltransferase inhibitors. Update on Cancer Therapeutics. 2006;1:17–23. doi: 10.1016/j.uct.2006.05.005. - DOI
Publication types
MeSH terms
Substances
LinkOut - more resources
Full Text Sources
Other Literature Sources
Molecular Biology Databases

