

Density estimation and adaptive bandwidths: a primer for public health practitioners
- PMID: 20653969
- PMCID: PMC2920858
- DOI: 10.1186/1476-072X-9-39
Density estimation and adaptive bandwidths: a primer for public health practitioners
Abstract
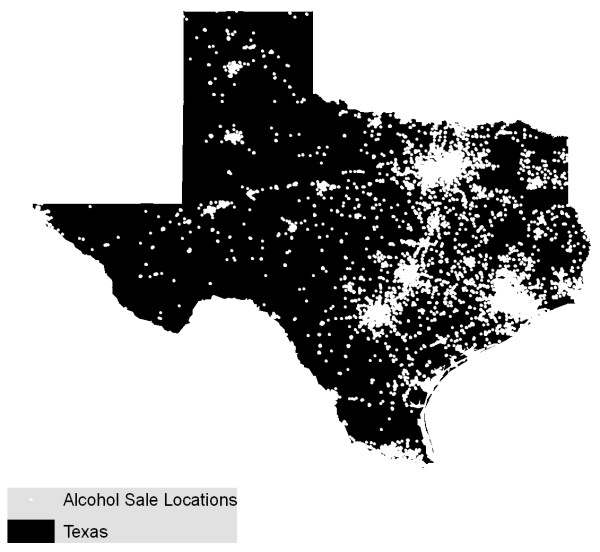
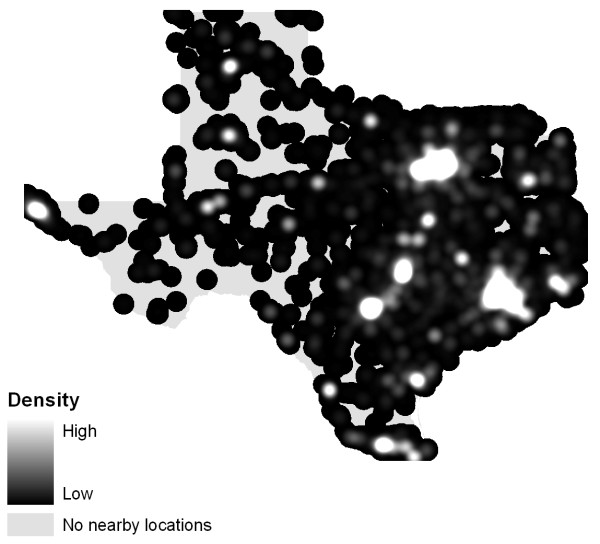
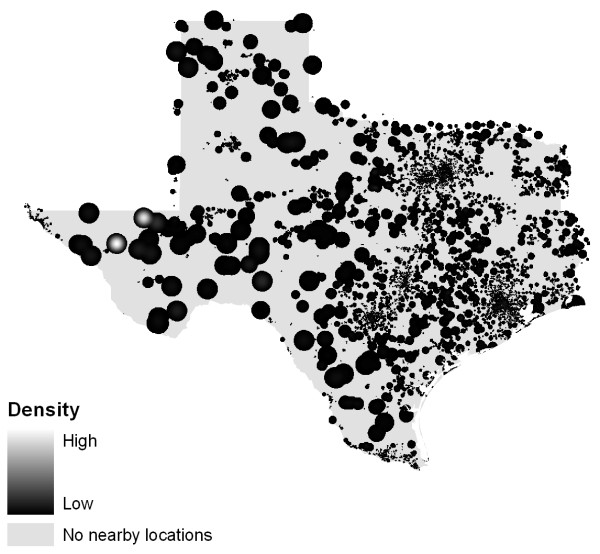
Background: Geographic information systems have advanced the ability to both visualize and analyze point data. While point-based maps can be aggregated to differing areal units and examined at varying resolutions, two problems arise 1) the modifiable areal unit problem and 2) any corresponding data must be available both at the scale of analysis and in the same geographic units. Kernel density estimation (KDE) produces a smooth, continuous surface where each location in the study area is assigned a density value irrespective of arbitrary administrative boundaries. We review KDE, and introduce the technique of utilizing an adaptive bandwidth to address the underlying heterogeneous population distributions common in public health research.
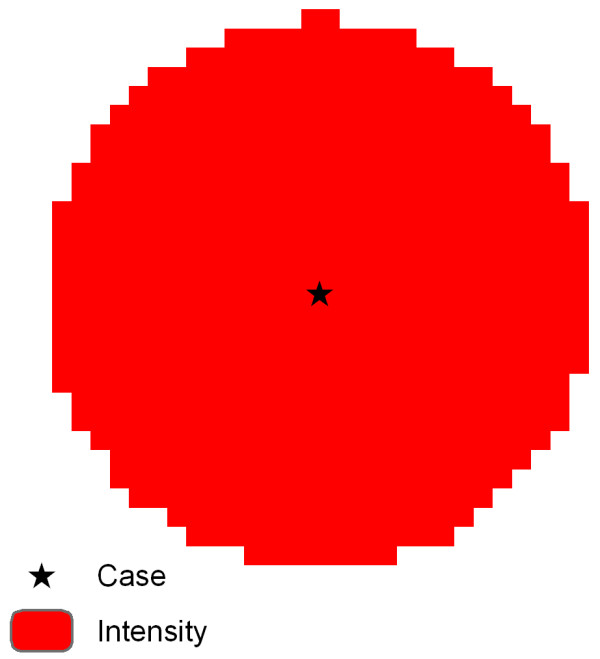
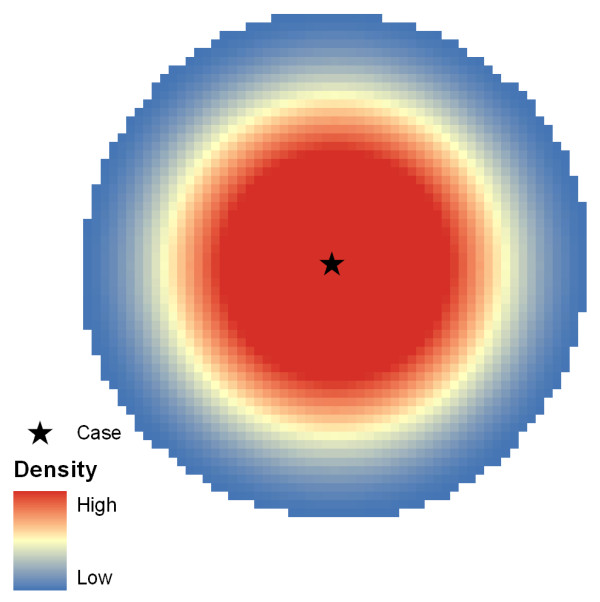
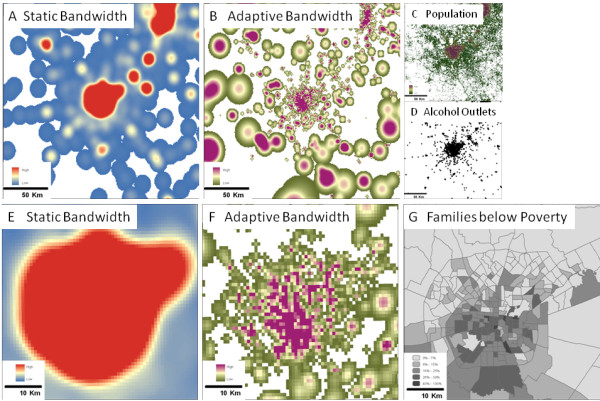
Results: The density of occurrences should not be interpreted without knowledge of the underlying population distribution. When the effect of the background population is successfully accounted for, differences in point patterns in similar population areas are more discernible; it is generally these variations that are of most interest. A static bandwidth KDE does not distinguish the spatial extents of interesting areas, nor does it expose patterns above and beyond those due to geographic variations in the density of the underlying population. An adaptive bandwidth method uses background population data to calculate a kernel of varying size for each individual case. This limits the influence of a single case to a small spatial extent where the population density is high as the bandwidth is small. If the primary concern is distance, a static bandwidth is preferable because it may be better to define the "neighborhood" or exposure risk based on distance. If the primary concern is differences in exposure across the population, a bandwidth adapting to the population is preferred.
Conclusions: Kernel density estimation is a useful way to consider exposure at any point within a spatial frame, irrespective of administrative boundaries. Utilization of an adaptive bandwidth may be particularly useful in comparing two similarly populated areas when studying health disparities or other issues comparing populations in public health.
Figures


References
-
- Snow J. On the mode of communication of cholera. 2. London,: J. Churchill; 1855.
-
- Tracking Swine Flu Cases Worldwide. The New York Times. 2009. http://www.nytimes.com/interactive/2009/04/27/us/20090427-flu-update-gra...
Publication types
MeSH terms
Grants and funding
LinkOut - more resources
Full Text Sources
