. 2010 Jul 25:10:218.
doi: 10.1186/1472-6963-10-218.

Price regulation, new entry, and information shock on pharmaceutical market in Taiwan: a nationwide data-based study from 2001 to 2004

Affiliations

Price regulation, new entry, and information shock on pharmaceutical market in Taiwan: a nationwide data-based study from 2001 to 2004

Fei-Yuan Hsiao et al. BMC Health Serv Res. .

Abstract

Background: Using non-steroidal anti-inflammatory drugs (NSAIDs) as a case, we used Taiwan's National Health Insurance (NHI) database, to empirically explore the association between policy interventions (price regulation, new drug entry, and an information shock) and drug expenditures, utilization, and market structure between 2001 and 2004.

Methods: All NSAIDs prescribed in ambulatory visits in the NHI system during our study period were included and aggregated quarterly. Segmented regression analysis for interrupted time series was used to examine the associations between two price regulations, two new drug entries (cyclooxygennase-2 inhibitors) and the rofecoxib safety signal and expenditures and utilization of all NSAIDs. Herfindahl index (HHI) was applied to further examine the association between these interventions and market structure of NSAIDs.

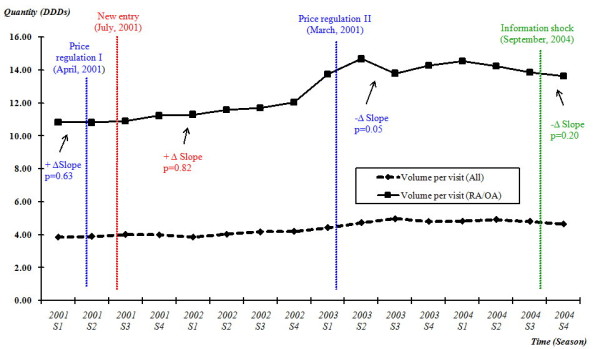
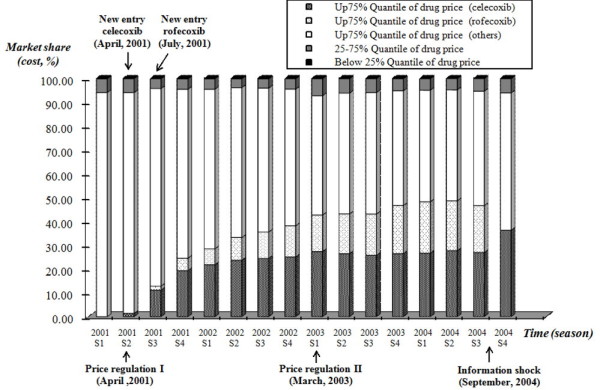
Results: New entry was the only variable that was significantly correlated with changes of expenditures (positive change, p = 0.02) and market structure of the NSAIDs market in the NHI system. The correlation between price regulation (first price regulation, p = 0.62; second price regulation, p = 0.26) and information shock (p = 0.31) and drug expenditure were not statistically significant. There was no significant change in the prescribing volume of NSAIDs per rheumatoid arthritis (RA) or osteoarthritis (OA) ambulatory visit during the observational period. The market share of NSAIDs had also been largely substituted by these new drugs up to 50%, in a three-year period and resulted in a more concentrated market structure (HHI 0.17).

Conclusions: Our empirical study found that new drug entry was the main driving force behind escalating drug spending, especially by altering the market share.


Figures

Figure 1
Figure 1
Expenditure of NSAIDs per RA/OA ambulatory visit, quarterly, 2001-2004. Quarterly expenditure of NSAIDs per RA or OA ambulatory visit was plotted with the timing of each policy intervention marked. Quarterly expenditure of NSAIDs per ambulatory visit (for any ambulatory visit with NSAID prescription) was also plotted separately as a reference group. The mean quarterly cost of NSAIDs per RA or OA ambulatory visit increased approximately 30% at the end of 2004 following the reimbursement of two new drugs (COX-2 inhibitors).
Figure 2
Figure 2
Volume (DDDs) of NSAIDs per RA/OA ambulatory visit, quarterly, 2001-2004. Quarterly prescribing volume of NSAIDs per RA or OA ambulatory visit was plotted with the timing of each policy intervention marked. Quarterly prescribing volume of NSAIDs per ambulatory visit (for any ambulatory visit with NSAID prescription) was also plotted separately as a reference group.
Figure 3
Figure 3
Market share of NSAIDs products, quarterly, 2001-2004. The market share (cost) of NASIDs products had been largely substituted by celecoxib and rofecoxib up to 26.92% and 19.68%, respectively, in a three-year period.
Figure 4
Figure 4
Diffusion pattern of two COX-2 inhibitors (market share; cost (NT dollars)), quarterly, 2001-2004. The market share (cost) of celecoxib in the NSAIDs market rapidly increased to 19.32% in only six months (2001 S4) after its listing into the NHI's benefit coverage and continued to increase thereafter. Its competitor, the follower COX-2 inhibitor (rofecoxib), however, took about two years to reach its market share (cost) to 20.22% (2003 S4) after its listing and sustained a 5% market share gap to celecoxib thereafter.
Figure 5
Figure 5
Market structure of major market of NSAIDs for RA/OA treatment, quarterly, 2001-2004. Number of products and drug companies that contributed to the top 80% NSAIDs market was plotted across time. Herfindahl index of concentration (HHI) was also provided to further estimate the effect of policy interventions on market structure of NSAIDs over time.

Similar articles

Cited by

References

    1. OECD. Health at a Glance: OECD Indicators 2005. OECD; 2005.
    1. Morgan S. Drug spending in Canada: recent trends and causes. Med Care. 2004;42:635–642. doi: 10.1097/01.mlr.0000129494.36245.4b. - DOI - PubMed
    1. Berndt ER. The U.S. pharmaceutical industry: why major growth in times of cost containment? Health Aff (Millwood) 2001;20:100–114. doi: 10.1377/hlthaff.20.2.100. - DOI - PubMed
    1. Morgan SG. Quantifying components of drug expenditure inflation: the British Columbia seniors' drug benefit plan. Health Serv Res. 2002;37:1243–1266. doi: 10.1111/1475-6773.01058. - DOI - PMC - PubMed
    1. Gerdtham UG, Lundin D. Why did drug spending increase during the 1990s? A decomposition based on Swedish data. Pharmacoeconomics. 2004;22:29–42. doi: 10.2165/00019053-200422010-00003. - DOI - PubMed

Publication types

Substances

LinkOut - more resources