. 2010 Jul 26:10:153.
doi: 10.1186/1471-2229-10-153.

Global transcriptome profiling of wild soybean (Glycine soja) roots under NaHCO3 treatment

Affiliations

Global transcriptome profiling of wild soybean (Glycine soja) roots under NaHCO3 treatment

Ying Ge et al. BMC Plant Biol. .

Abstract

Background: Plant roots are the primary site of perception and injury for saline-alkaline stress. The current knowledge of saline-alkaline stress transcriptome is mostly focused on saline (NaCl) stress and only limited information on alkaline (NaHCO3) stress is available.

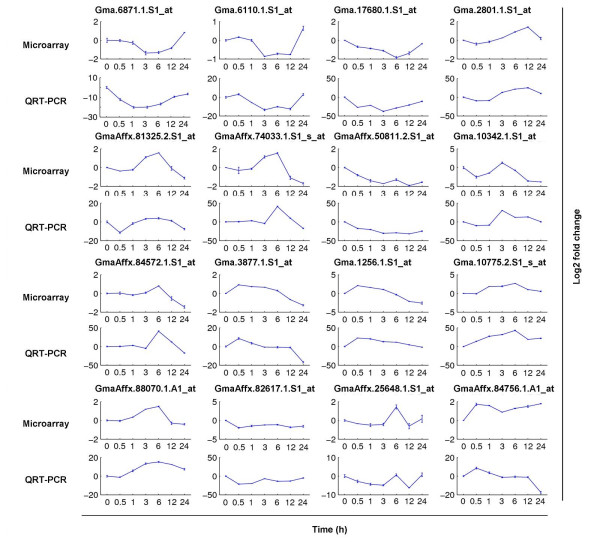
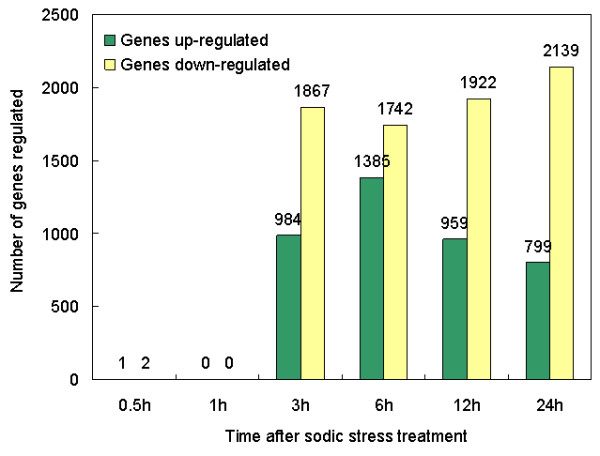
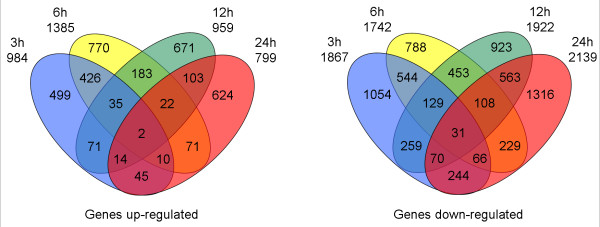
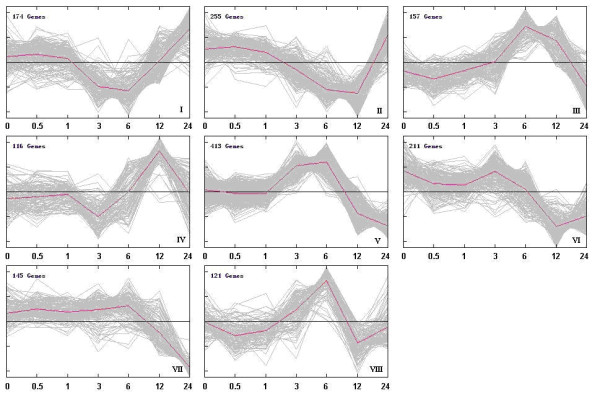
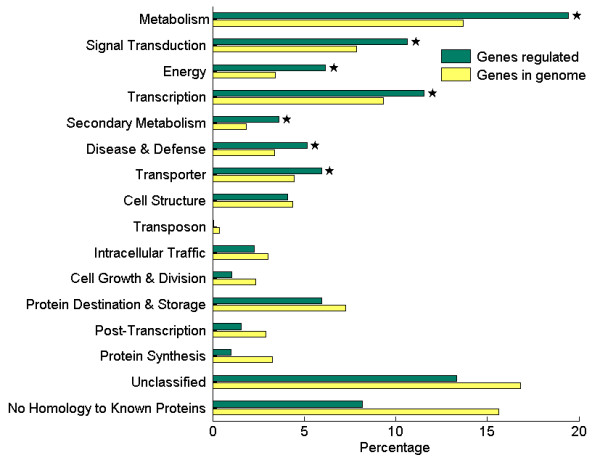
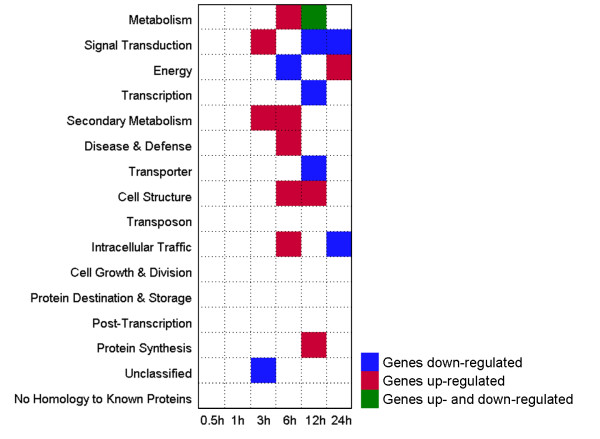
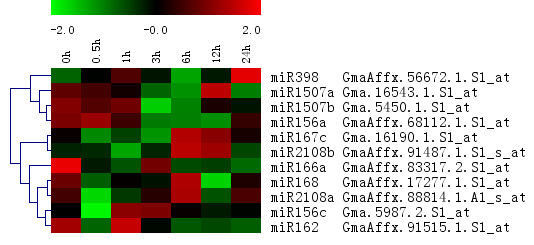
Results: Using Affymetrix Soybean GeneChip, we conducted transcriptional profiling on Glycine soja roots subjected to 50 mmol/L NaHCO3 treatment. In a total of 7088 probe sets, 3307 were up-regulated and 5720 were down-regulated at various time points. The number of significantly stress regulated genes increased dramatically after 3 h stress treatment and peaked at 6 h. GO enrichment test revealed that most of the differentially expressed genes were involved in signal transduction, energy, transcription, secondary metabolism, transporter, disease and defence response. We also detected 11 microRNAs regulated by NaHCO3 stress.

Conclusions: This is the first comprehensive wild soybean root transcriptome analysis under alkaline stress. These analyses have identified an inventory of genes with altered expression regulated by alkaline stress. The data extend the current understanding of wild soybean alkali stress response by providing a set of robustly selected, differentially expressed genes for further investigation.


Figures

Figure 1
Figure 1
Validation of microarray expression with QRT-PCR. Genes were randomly selected from our findings. The x-axis represents hours of stress. The y-axis is log2 fold change.
Figure 2
Figure 2
Number of genes differentially expressed in roots under saline-alkaline stress treatment. Total number of genes differentially up- (green bars) and down-regulated (yellow bars) in roots under 50 mmol/L NaHCO3 stress treatment compared with the sample without stress (P < 0.05, q < 0.15). The x-axis represents hours of stress. The y-axis represents number of probe sets. The tissues for RNA extraction were harvested at the indicated time points. See Methods for data normalization, processing, statistical analysis and classification of differentially expressed genes.
Figure 3
Figure 3
Venn diagram, depicting the overlap of regulated genes at various time points. The number outside the circle denotes the total number of genes up- (on the left) or down- (on the right) regulated at specific time point. The number within one circle or more than two circles denotes the time specific genes or overlapped genes, respectively.
Figure 4
Figure 4
Dynamic expression pattern of different clusters during NaHCO3 stress. Genes with altered expression over time were identified by Edge [80,81] time course methodology (q value < 0.001). K-means clustering was performed to identify 8 clusters, each containing various numbers of genes with similar expression pattern under NaHCO3 stress. The red lines show representative transcriptional regulators. The x-axis represents the stress treatment time in hours. The y-axis represents normalized log2 microarray expression data.
Figure 5
Figure 5
Functional categorization of genes respond to NaHCO3 stress and of all genes in Glycine soja. There are 16 functional categories. Functional categorization for gene group regulated by NaHCO3 stress treatment (total number, 1592) (green bars) and for whole genome genes (yellow bars) were shown with their percentages. Category significantly over-represented in the respond group was shown with asterisk (P < 0.01, FDR < 0.05).
Figure 6
Figure 6
GO enrichment analysis of the differentially expressed genes. Blue or Red square denotes the functional category over-represented in up-or down-regulated genes at that time point. Green square denotes the functional category over-represented in both up-and down-regulated genes. The x-axis represents the length of stress treatment time. The y-axis represents functional categories (p < 0.01, FDR < 0.05).
Figure 7
Figure 7
Genes up/down regulated in the overview of secondary metabolism. Mapman was used to visualize the secondary metabolism pathways with genes up/down regulated at 3 h, 6 h, 12 h, and 24 h. In the display, each BIN or subBIN is represented as a block where each transcript is displayed as a square, which is either colored red if this transcript is up- or blue if this transcript is down-regulated.
Figure 8
Figure 8
Transcription factors families of the up-regulated genes at the early stage of NaHCO3 treatment. There are 29 transcription factors families. Transcription factors families for gene group induced at 3 h and 6 h of NaHCO3 stress treatment (total number, 147) (green bars) and for whole genome genes (yellow bars) were shown with their percentages. Transcription factors family significantly over-represented in the respond group was shown with asterisk (P < 0.01, FDR < 0.05).
Figure 9
Figure 9
Expression profile of pre-microRNAs under NaHCO3 stress. The pre-microRNAs probe sets were annotated with the predicted microRNAs. Pearson correlation Hierarchical clustering of averaged expression value from two biological replicates was shown.

Similar articles

Cited by

References

    1. Jiang Y, Deyholos MK. Comprehensive transcriptional profiling of NaCl-stressed Arabidopsis roots reveals novel classes of responsive genes. BMC Plant Biology. 2006;6:25. doi: 10.1186/1471-2229-6-25. - DOI - PMC - PubMed
    1. Ge Y, Zhu YM, Lv DK, Dong TT, Wang WS, Tan SJ, Liu CH, Zou P. Research on responses of wild soybean to alkaline stress. Pratacultural Science. 2009;26(2):47–52.
    1. Kilian J, Whitehead D, Horak J, Wanke D, Weinl S, Batistic O, D'Angelo C, Bornberg-Bauer E, Kudla J, Harter K. The AtGenExpress global stress expression data set: protocols, evaluation and model data analysis of UV-B light, drought and cold stress responses. Plant Journal. 2007;50(2):347–363. doi: 10.1111/j.1365-313X.2007.03052.x. - DOI - PubMed
    1. Seki M, Narusaka M, Ishida J, Nanjo T, Fujita M, Oono Y, Kamiya A, Nakajima M, Enju A, Sakurai T. Monitoring the expression profiles of 7000 Arabidopsis genes under drought, cold and high-salinity stresses using a full-length cDNA microarray. Plant Journal. 2002;31(3):279–292. doi: 10.1046/j.1365-313X.2002.01359.x. - DOI - PubMed
    1. Takahashi S, Seki M, Ishida J, Satou M, Sakurai T, Narusaka M, Kamiya A, Nakajima M, Enju A, Akiyama K. Monitoring the expression profiles of genes induced by hyperosmotic, high salinity, and oxidative stress and abscisic acid treatment in Arabidopsis cell culture using a full-length cDNA microarray. Plant Molecular Biology. 2004;56:29–55. doi: 10.1007/s11103-004-2200-0. - DOI - PubMed

Publication types

MeSH terms

Substances