. 2010 Nov;1804(11):2136-45.
doi: 10.1016/j.bbapap.2010.07.013. Epub 2010 Jul 21.

Probing the two-domain structure of homodimeric prokaryotic and eukaryotic catalase-peroxidases

Affiliations

Probing the two-domain structure of homodimeric prokaryotic and eukaryotic catalase-peroxidases

Srijib Banerjee et al. Biochim Biophys Acta. 2010 Nov.

Abstract

Catalase-peroxidases (KatGs) are ancestral bifunctional heme peroxidases found in archaeons, bacteria and lower eukaryotes. In contrast to homologous cytochrome c peroxidase (CcP) and ascorbate peroxidase (APx) homodimeric KatGs have a two-domain monomeric structure with a catalytic N-terminal heme domain and a C-terminal domain of high sequence and structural similarity but without obvious function. Nevertheless, without its C-terminal counterpart the N-terminal domain exhibits neither catalase nor peroxidase activity. Except some hybrid-type proteins all other members of the peroxidase-catalase superfamily lack this C-terminal domain. In order to probe the role of the two-domain monomeric structure for conformational and thermal stability urea and temperature-dependent unfolding experiments were performed by using UV-Vis-, electronic circular dichroism- and fluorescence spectroscopy, as well as differential scanning calorimetry. Recombinant prokaryotic (cyanobacterial KatG from Synechocystis sp. PCC6803) and eukaryotic (fungal KatG from Magnaporthe grisea) were investigated. The obtained data demonstrate that the conformational and thermal stability of bifunctional KatGs is significantly lower compared to homologous monofunctional peroxidases. The N- and C-terminal domains do not unfold independently. Differences between the cyanobacterial and the fungal enzyme are relatively small. Data will be discussed with respect to known structure and function of KatG, CcP and APx.


Figures

Fig. 1
Fig. 1
Monitoring urea-mediated denaturation of Magnaporthe grisea KatG1 (A, C, E) and Synechocystis KatG (B, D, F) by heme Soret spectroscopy. (A) Spectral transition of 2.2 μM recombinant Magnaporthe grisea KatG1 in 5 mM phosphate buffer, pH 7.0, mediated by various urea concentrations (incubation time 18 h at 25 °C): 0 M (gray line), 1.5, 2, 2.5 and 5 M). (B) Spectral transition of 3.8 μM recombinant Synechocystis KatG in 5 mM phosphate buffer, pH 7.0, mediated by various urea concentrations (incubation time 18 h at 25 °C): 0 M (gray line), 1.0, 1.5, 2.0 and 3.5 M urea). (C, D) Plots of Soret maximum and absorbance at 408 nm in dependence of urea concentration. Conditions as in (A, B). (E, F) Standard free enthalpies as a function of urea concentration. ΔG° values have been calculated from plots of absorbance at 408 nm versus urea concentration as described in Materials and methods.
Fig. 2
Fig. 2
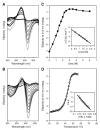
Monitoring urea- and temperature-mediated unfolding of KatG from Magnaporthe grisea by heme electronic circular dichroism (ECD) spectroscopy. (A) Soret circular dichroism spectra of 6 μM native Magnaporthe grisea KatG (gray line) incubated with various concentration of urea (0.5, 1, 1.25, 1.5, 1.75, 2, 2.25 and 6 M) for 18 h at 25 °C. Panel (B) shows the changes in ECD spectra during the thermal transition of Magnaporthe grisea KatG (8.7 μM) in 5 mM phosphate buffer, pH 7.0, containing 0.5 M urea. The ECD spectrum at 25 °C is depicted in gray. Panel (C) shows the change in CD ellipticity at 412 nm as a function of denaturant concentration for MagKatG. Inset shows the change in standard free enthalpy with urea concentration. Panel (D) along with the insets shows the loss of CD ellipticity at 412 nm in MagKatG1 with increasing temperature and the corresponding Van’t Hoff plot.
Fig. 3
Fig. 3
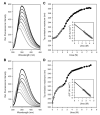
Denaturation of Magnaporthe grisea KatG1 and Synechocystis KatG by urea as monitored by fluorescence spectroscopy. (A) Fluorescence emission spectra of Magnaporthe grisea KatG (0.5 μM) in 5 mM phosphate buffer, pH 7.0, upon 18 h (25 °C) incubation with various concentrations of urea [0 M (gray line), 2.25, 2.5, 3.5, 4, 5.25, 7.25 and 7.8 M]. (B) Fluorescence emission spectra of Synechocystis KatG (0.5 μM) in 5 mM phosphate buffer, pH 7.0, upon 18 h (25 °C) incubation with various concentrations of urea [0 M (gray line), 0.25, 0.5, 1, 1.75, 3, 5, 6.5, and 7.5 M]. (C, D) Plot of change in Trp emission maximum versus urea concentration. Conditions as in (A, B). The inset depicts the corresponding stability curve (ΔG° versus urea concentration) and fit for the second transition. Gray spectra and circles indicate first transition (≤2.25 M urea), black spectra and circles represent second transition. Excitation: 295 nm, emission range: 300–450 nm.
Fig. 4
Fig. 4
Thermal stability of the heme cavity of Magnaporthe grisea KatG1 and Synechocystis KatG as monitored by electronic absorbance spectroscopy. Change in heme Soret spectra during thermal denaturation of MagKatG (A) and SynKatG (B). (C, D) Change in Soret maximum (●) and decrease of Soret intensity (○, at 408 nm) of Magnaporthe grisea KatG (8.7 μM) and Synechocystis KatG (7.95 μM) in 5 mM phosphate buffer, pH 7.0, containing 0.5 M urea. (E, F) Van’t Hoff plots and fits.
Fig. 5
Fig. 5
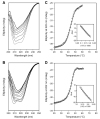
Overall thermal stability of Magnaporthe grisea KatG1 and Synechocystis KatG followed by far-UV ECD. Changes in ECD spectra of 5 μM Magnaporthe grisea KatG1 (A) and 5 μM Synechocystis KatG (B) with increasing temperature. Buffer: 5 mM phosphate buffer, pH 7.0, containing 0.5 M urea. (C, D) Corresponding changes in ellipticity at 222 nm in MagKatG1 (C) and SynKatG (D). Insets: Van’t Hoff plots and fits.
Fig. 6
Fig. 6
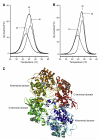
Differential scanning calorimetry of Magnaporthe grisea KatG1 and Synechocystis KatG and dimeric structure of KatG. Normalised DSC thermograms of MagKatG1 (A) and SynKatG (B) after pre and post-transitional baseline subtraction. Conditions: 4 μM enzyme in 5 mM phosphate buffer, pH 7.0, containing 0.5 M urea. Fit of experimental data points (gray line) to a non-two-state model with two unfolding transitions shown in black. (C) Dimeric structure of Burkholderia pseudomallei KatG (PDB code: 1MWV). Blue and orange: heme-containing N-terminal domains, red and green: C-terminal domains. Figure was constructed with PyMOL.

Similar articles

Cited by

References

    1. Klotz M, Loewen PC. The molecular evolution of catalatic hydroperoxidases: evidence for multiple lateral transfer of genes between prokaryota and form bacteria into eukaryota. Mol. Biol. Evol. 2003;20:1098–1112. - PubMed
    1. Passardi F, Bakalovic N, Teixeira FK, Margis-Pinheiro M, Penel C, Dunand C. Prokaryotic origins of the non-animal peroxidase superfamily and organelle-mediated transmission to eukaryotes. Genomics. 2007;89:567–579. - PubMed
    1. Zamocky M, Obinger C. Molecular phylogeny of heme peroxidases. In: Ayala M, Torres E, editors. Biocatalysis Based on Heme Peroxidases. Springer; 2010. ISBN: 978-3-642-12626-0.
    1. Passardi F, Zamocky M, Favet J, Jakopitsch C, Penel C, Obinger C, Dunand C. Phylogenetic distribution of catalase-peroxidases: are there patches of order in chaos? Gene. 2007;397:101–113. - PubMed
    1. Zamocky M, Furtmüller PG, Obinger C. Two distinct groups of fungal catalase/peroxidases. Biochem. Soc. Trans. 2009;37:772–777. - PMC - PubMed

Publication types

LinkOut - more resources