

Epigenetic regulation of high glucose-induced proinflammatory cytokine production in monocytes by curcumin
- PMID: 20655188
- PMCID: PMC3010508
- DOI: 10.1016/j.jnutbio.2010.03.014
Epigenetic regulation of high glucose-induced proinflammatory cytokine production in monocytes by curcumin
Abstract
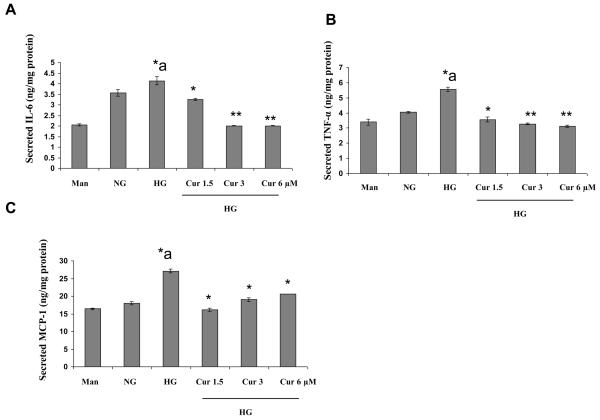
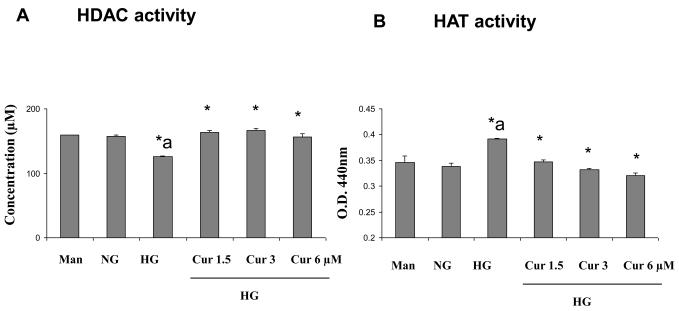
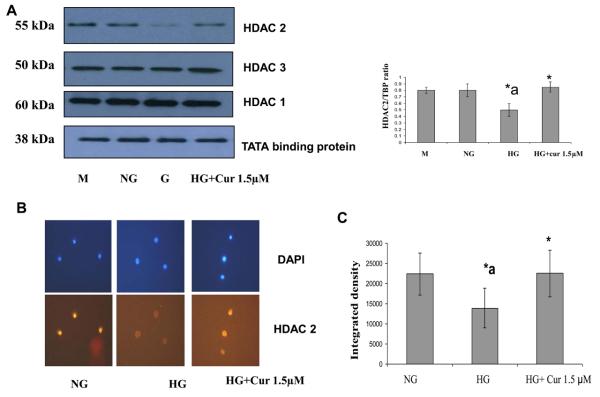
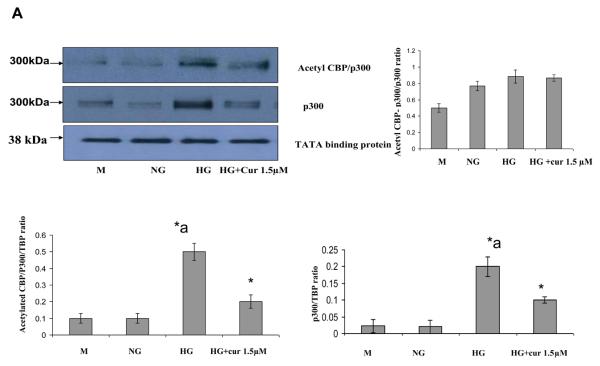
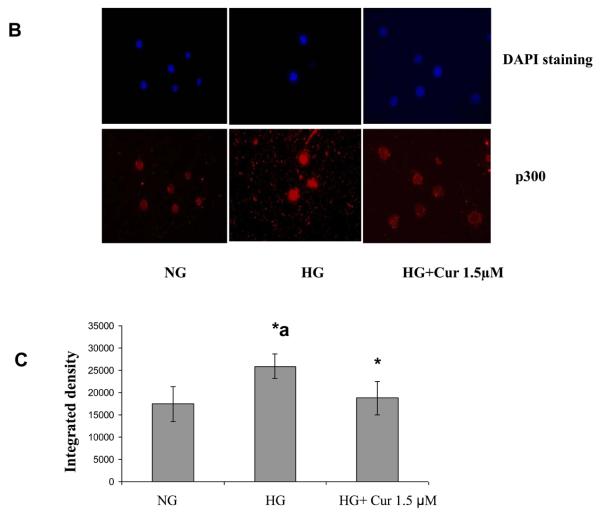
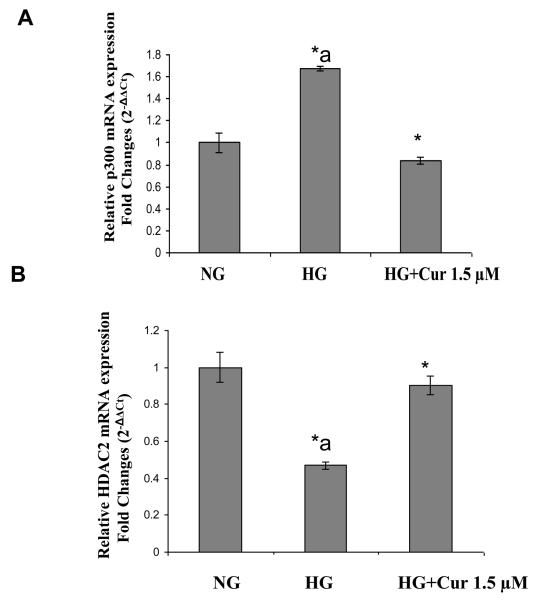
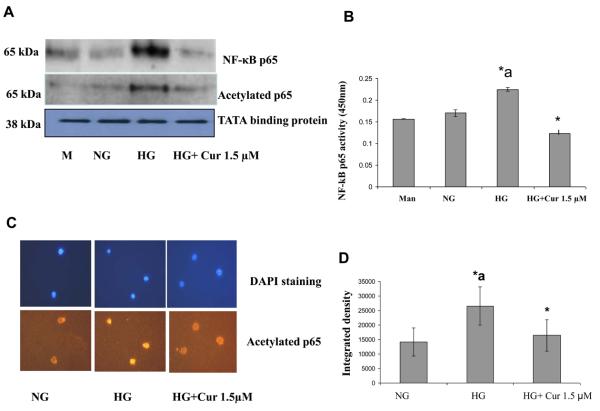
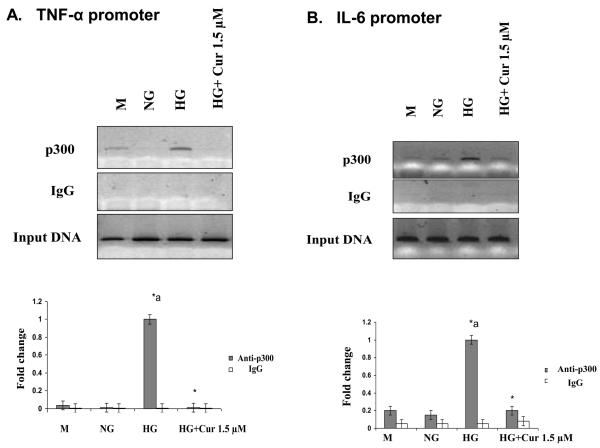
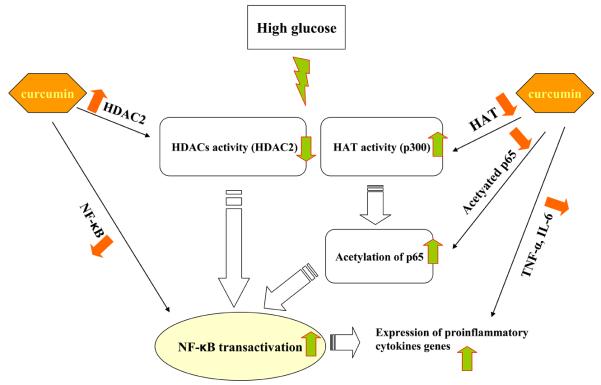
Diabetes is a proinflammatory state. We have previously shown increased monocyte proinflammatory cytokines in patients with Type 1 and Type 2 diabetes. High glucose induces proinflammatory cytokines via epigenetic changes. Curcumin, a polyphenol responsible for the yellow color of the spice turmeric, is known to exert potent anti-inflammatory activity in vitro. Recent studies indicate that it may regulate chromatin remodeling by inhibiting histone acetylation. In this study, we aimed to test the effect of curcumin on histone acetylation and proinflammatory cytokine secretion under high-glucose conditions in human monocytes. Human monocytic (THP-1) cells were cultured in presence of mannitol (osmolar control, mannitol) or normoglycemic (NG, 5.5 mmol/L glucose) or hyperglycemic (HG, 25 mmol/L glucose) conditions in absence or presence of curcumin (1.5-12.5 μM) for 72 h. Cytokine level, nuclear factor κB (NF-κB) transactivation, histone deacetylases (HDACs) activity, histone acetylases (HATs) activity were measured by western blots, quantitative reverse transcriptase-polymerase chain reaction, enzyme-linked immunosorbent assay, immunofluorescence staining. HG significantly induced histone acetylation, NF-κB activity and proinflammatory cytokine (interleukin 6, tumor necrosis factor α and MCP-1) release from THP-1 cells. Curcumin suppressed NF-κB binding and cytokine release in THP-1 cells. Also, since p300 histone acetyltransferase is a coactivator of NF-κB, we examined its acetylation. Curcumin treatment also significantly reduced HAT activity, level of p300 and acetylated CBP/p300 gene expression, and induced HDAC2 expression by curcumin. These results indicate that curcumin decreases HG-induced cytokine production in monocytes via epigenetic changes involving NF-κB. In conclusion, curcumin supplementation by reducing vascular inflammation may prevent diabetic complications.
Copyright © 2011 Elsevier Inc. All rights reserved.
Figures
Similar articles
-
(-)-Epicatechin attenuates high-glucose-induced inflammation by epigenetic modulation in human monocytes.Eur J Nutr. 2017 Apr;56(3):1369-1373. doi: 10.1007/s00394-015-1136-2. Epub 2015 Dec 24. Eur J Nutr. 2017. PMID: 26704714
-
Luteolin inhibits hyperglycemia-induced proinflammatory cytokine production and its epigenetic mechanism in human monocytes.Phytother Res. 2014 Sep;28(9):1383-91. doi: 10.1002/ptr.5141. Epub 2014 Mar 12. Phytother Res. 2014. PMID: 24623679
-
Gallic Acid Decreases Inflammatory Cytokine Secretion Through Histone Acetyltransferase/Histone Deacetylase Regulation in High Glucose-Induced Human Monocytes.J Med Food. 2015 Jul;18(7):793-801. doi: 10.1089/jmf.2014.3342. Epub 2015 Mar 25. J Med Food. 2015. PMID: 25807193
-
NF-κB pathway as a molecular target for curcumin in diabetes mellitus treatment: Focusing on oxidative stress and inflammation.Cell Biochem Funct. 2024 Jun;42(4):e4030. doi: 10.1002/cbf.4030. Cell Biochem Funct. 2024. PMID: 38720663 Review.
-
The role dietary of bioactive compounds on the regulation of histone acetylases and deacetylases: a review.Gene. 2015 May 10;562(1):8-15. doi: 10.1016/j.gene.2015.02.045. Epub 2015 Feb 19. Gene. 2015. PMID: 25701602 Review.
Cited by
-
Diabetic nephropathy--emerging epigenetic mechanisms.Nat Rev Nephrol. 2014 Sep;10(9):517-30. doi: 10.1038/nrneph.2014.116. Epub 2014 Jul 8. Nat Rev Nephrol. 2014. PMID: 25003613 Free PMC article. Review.
-
Epigenetic targets of bioactive dietary components for cancer prevention and therapy.Clin Epigenetics. 2010 Dec 1;1(3-4):101-116. doi: 10.1007/s13148-010-0011-5. Clin Epigenetics. 2010. PMID: 21258631 Free PMC article.
-
Fisetin inhibits hyperglycemia-induced proinflammatory cytokine production by epigenetic mechanisms.Evid Based Complement Alternat Med. 2012;2012:639469. doi: 10.1155/2012/639469. Epub 2012 Dec 20. Evid Based Complement Alternat Med. 2012. PMID: 23320034 Free PMC article.
-
Epigenetics in obesity: Mechanisms and advances in therapies based on natural products.Pharmacol Res Perspect. 2024 Feb;12(1):e1171. doi: 10.1002/prp2.1171. Pharmacol Res Perspect. 2024. PMID: 38293783 Free PMC article. Review.
-
Physicochemical, Structural, and In Vitro Gastrointestinal Tract Release Properties of Sodium Alginate-Based Cryogel Beads Filled with Hydroxypropyl Distarch Phosphate as a Curcumin Delivery System.Molecules. 2022 Dec 21;28(1):31. doi: 10.3390/molecules28010031. Molecules. 2022. PMID: 36615227 Free PMC article.
References
-
- Brownlee M. Glycation and diabetic complications. Diabetes. 1994;43:826–41. - PubMed
-
- Lyons T. Glycation and oxidation: a role in the pathogenesis of atherosclerosis. Am J Cardiol. 1993;71:26B–31B. - PubMed
-
- Vlassara H, Bucala R, Sturcker L. Pathogenic effects of advanced glycosylation: biochemical, biologic, and clinical implications for diabetes and aging. Lab Invest. 1994;70:138–51. - PubMed
-
- Guha M, Bai W, Nadler J, Natarajan R. Molecular mechanisms of TNF-alpha gene expression in monocytic cells via hyglycemia-induced oxidant stress dependent and independent pathways. J Biol Chem. 2000;275:17728–39. - PubMed
-
- Shanmugam N, Reddy MA, Guha M, Natarajan R. High-glucose–induced expression of proinflammatory cytokine and chemokine genes in monocytic cells. Diabetes. 2003;52:1256–64. - PubMed
Publication types
MeSH terms
Substances
Grants and funding
LinkOut - more resources
Full Text Sources
Other Literature Sources
Miscellaneous
