. 2010 Jul 23;142(2):296-308.
doi: 10.1016/j.cell.2010.06.003.

Insulin signaling in osteoblasts integrates bone remodeling and energy metabolism

Affiliations

Insulin signaling in osteoblasts integrates bone remodeling and energy metabolism

Mathieu Ferron et al. Cell. .

Abstract

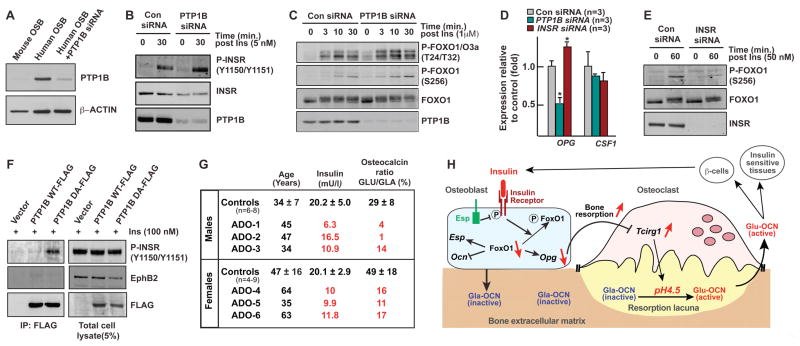
The broad expression of the insulin receptor suggests that the spectrum of insulin function has not been fully described. A cell type expressing this receptor is the osteoblast, a bone-specific cell favoring glucose metabolism through a hormone, osteocalcin, that becomes active once uncarboxylated. We show here that insulin signaling in osteoblasts is necessary for whole-body glucose homeostasis because it increases osteocalcin activity. To achieve this function insulin signaling in osteoblasts takes advantage of the regulation of osteoclastic bone resorption exerted by osteoblasts. Indeed, since bone resorption occurs at a pH acidic enough to decarboxylate proteins, osteoclasts determine the carboxylation status and function of osteocalcin. Accordingly, increasing or decreasing insulin signaling in osteoblasts promotes or hampers glucose metabolism in a bone resorption-dependent manner in mice and humans. Hence, in a feed-forward loop, insulin signals in osteoblasts activate a hormone, osteocalcin, that promotes glucose metabolism.


Figures

Figure 1
Figure 1. Insulin receptor is a substrate of OST-PTP in osteoblasts
(A) Western blot analysis of insulin receptor (InsR) expression in tissues and primary osteoblasts (OSB). (B) In vivo phosphorylation of InsR and EGFR in bone following injection of a bolus of insulin. (C) In vitro substrate trapping. Extracts from pervanadate-treated ROS17/2.8 cells or primary osteoblasts (OSB) were pulled down using GST or WT and DA mutants of OST-PTP and PTP1B GST-fusion proteins. InsR was detected by western blot. (D) In vitro substrate trapping conducted as described in (C) in absence or presence of increasing concentration of sodium orthovanadate (NaVanadate). (E) In vivo substrate trapping. OST-PTP-WT and –DA FLAG tagged proteins were immunoprecipitated from ROS17/2.8 cells after 15 minutes stimulation with EGF (100 ng/ml) or insulin (100 nM). Immunoprecipitated proteins (IP) and total cell lysates were then analyzed by western blot. (F) In vitro dephosphorylation assay. Hyperphosphorylated InsR was immunoprecipitated (IP) from pervanadate-treated ROS17/2.8 extracts, incubated with indicated recombinant proteins for 30 min and visualized by western blot. (G) Time course of InsR dephosphorylation in vitro by OST-PTP and PTP1B. Experiment was conducted as in (E) except that incubations were stopped at the indicated times. (H) Phosphorylation of InsR and FoxO1 in unstimulated WT and Esp−/− osteoblasts. See also Figure S1.
Figure 2
Figure 2. Decreased insulin secretion, glucose tolerance and insulin tolerance in InsRosb −/− mice
All experiments compare 8–12 week-old male mice; genotypes are indicated in each panel. (A) Random fed blood glucose levels. (B) Fasted and random fed insulin levels. (C) GSIS. (D) Pancreas insulin content and histomorphometric comparisons of islet number, islet size, β-cell mass and Ki67 immunoreactive cells in pancreatic islets. (E) GTT. (F) ITT. (G) Area under the curve of C, E and F. (H) Energy balance data: oxygen consumed (VO2), carbon dioxide produced (VCO2) and Heat. (I–L) Rescue of the InsRosb−/− phenotype by FoxO1 haploinsufficiency, (I) GSIS, (J) GTT, (K) ITT. (L) Area under the curve of I, J and K. *p<0.05 and **p<0.01 and ***p<0.001 vs InsRfl/fl in A–H (t-test or ANOVA) or vs InsRfl/fl and InsRosb−/−;FoxO1osb+/− in I–L (ANOVA). See also Figure S2.
Figure 3
Figure 3. Genetic interaction between InsR, Esp and Osteocalcin
All experiments compare 6–8 week-old male mice unless otherwise noted. (A) Random fed blood glucose level. (B) GSIS. (C and F) GTT. (D and G) ITT. (E) Area under the curve of B, C and D. (H) Area under the curve of F and G. (I) Model of InsR signaling in osteoblasts. (J) Carboxylation levels of serum osteocalcin assessed by GLU/GLA dual ELISA. In (A–E), *p<0.05 and **p<0.01 InsRosb+/−;Ocn+/− vs InsRfl/+, InsRosb+/− and Ocn+/− (ANOVA). #p<0.05 and ##p<0.01 Ocn−/− vs InsRfl/+, InsRosb+/− and Ocn+/− (ANOVA). In (F-H), *p<0.05, **p<0.01 and ***p<0.001 vs InsRfl/+, InsRosb+/− and Esp−/−; InsRosb+/− (ANOVA). In (J), *p<0.05 vs InsRfl/fl (t-test). °p <0.05 vs InsRfl/+ (t test). See also Figure S3.
Figure 4
Figure 4. Insulin signaling in osteoblasts favors osteoclast function
Mice genotypes are indicated in each panel. (A) CTx serum levels in 8 week-old mice. (B) Differentiation and resorptive ability of osteoclasts co-cultured in presence of control or mutant osteoblasts. (C) Expression of Opg, Rankl and Csf1 in mouse osteoblasts by real-time PCR. (D) Secretion of OPG in Esp−/− and WT osteoblasts. (E) Opg expression and OPG secretion in osteoblasts following a 4h and 24h insulin treatment, respectively. (F) Dose dependent effects of OPG on differentiation and resorptive ability of osteoclasts in presence of 30ng/ml RANKL and 10 ng/ml M-CSF. Representative pictures of TRAP staining and pit assay (left panel). Quantification of the number of the pits area (middle panel) and of TRAP positive cells (right panel). (G–H) Real-time PCR analysis of Opg expression and/or secretion in ROS17/2.8 osteoblastic cells transfected with empty (pFLAG) or FoxO1 expression (FoxO1-FLAG) vector (G) or in mouse osteoblasts transfected with control siRNA (Con siRNA) or FoxO1 siRNA (H). (I and J) Expression of Opg in bone (I) and CTx serum levels (J) in 1 and 3 month-old mice. (K, L) Real-time PCR analysis of Ctsk, Tcirg1 and Trap expression in bone (K) and in osteoclasts co-cultured in presence of control or InsR−/− osteoblasts (L). (M) Real-time PCR analysis of the Opg/Rankl expression ratio in bones of 3 month-old male mice. In (A–D, G–I, K–L), *p<0.05 and **p<0.01 vs corresponding controls (t-test). In (F), *p<0.05 vs 0ng/ml OPG (t-test). In (E) *p<0.05 vs WT+vehicle (ANOVA). In (J, M) *p<0.05 vs InsRfl/fl and InsRosb−/−;FoxO1osb+/− (ANOVA). See also Figure S4.
Figure 5
Figure 5. An acidic environment suffices to decarboxylate osteocalcin γ-carboxyglutamic acid 13
(A) High resolution mass spectrometry analysis of carboxylated osteocalcin incubated for 2 weeks at pH7.5 or pH4.5. (B) Tandem mass spectrometry analysis of trypsin-digested samples of carboxylated osteocalcin incubated at pH 7.5 and 4.5. (C) Insulin secretion from INS-1 cells following a 1h treatment with the indicated forms of osteocalcin. (D) Total, GLA and GLU osteocalcin released from bovine bone slices seeded with osteoclast progenitors treated with RANKL or vehicle or medium alone measured by ELISA. (E) GLU/GLA ratio of the osteocalcin released from bovine bone slices seeded with osteoclast progenitors treated with RANKL or vehicle and osteocalcin chemically extracted from bone slide measured by dual ELISA. (F–L) Analysis of 2–3 week-old WT and oc/oc mice. (F) Carboxylation ratio of serum osteocalcin measured by dual ELISA. (G) Insulin secretion from INS-1 cells following a 1h treatment with conditioned media (CM) from ex-vivo cultures of calvaria from WT and oc/oc mice. (H) GTT at 2 weeks of age by IP injecting mice wth glucose (1g/kg) under random fed condition. (I) Area under the curve of H. (J) Random fed insulin levels. (K) Pancreas insulin content. (L) Expression of Insulin genes (Ins1 and Ins2) and Glucagon (Gcg) in pancreas by real-time PCR. (M–T) Analysis of 10–12 week-old WT mice transplanted with either WT (WT+WT) or oc/oc (WT+oc/oc) fetal liver hematopoietic stem cells. (M) Quantification of the resorptive ability of osteoclasts derived from transplanted mice cultured in presence of RANKL and M-CSF. (N) Random fed blood glucose levels. (O) Fasted and random fed insulin levels. (P) GSIS. (Q) GTT. (R) Area under the curve of P and Q. (S) Energy balance data: oxygen consumed (VO2), carbon dioxide produced (VCO2) and Heat. (T) Carboxylation ratio of serum osteocalcin measured by dual ELISA. In (C), **p<0.01 and ***p<0.001 vs control and GLA-OCN pH7.5 (ANOVA). In (D–E, G), *p<0.05 and **p<0.01 vs control and/or medium (ANOVA). In (F, I–O, R–T), *p<0.05 and **p<0.01 vs WT (t-test). In (H, P–Q), *p<0.05 and **p<0.01 vs WT (ANOVA). See also Figure S5.
Figure 6
Figure 6. Insulin signaling in osteoblasts favors glucose homeostasis by promoting bone resorption
(A–I) Analysis of 7–9 week-old (A–D) or 6–7 week-old (D–I) male mice of indicated genotypes. (J–N) Analysis of 6 week-old WT and Esp−/− mice treated with vehicle (Veh.) or alendronate (Alend., 80μg/kg/week) for 4 weeks. (O–S) Analysis of 16 week-old WT mice fed a normal or a high fat diet (HFD) and treated with GST or GST-RANKL (0.8 mg/kg/day) for 8 weeks. (A, F, K and O) Carboxylation ratios of serum osteocalcin measured by dual ELISA. (B, G, L and P) GSIS. (C, H, M and Q) GTT. (D, I, N and R) ITT. (E, J) CTx serum levels. (S) Epididymal fat pad mass. In (A), °P <0.05 vs InsRfl/+ and InsRosb+/− (ANOVA). In (B–D), *p <0.05 vs InsRfl/+, InsRosb+/− and InsRfl/+;oc/+ (ANOVA). In (E–I), *p<0.05 vs WT, Esp−/−;oc/+ and oc/+ (ANOVA). In (J–N), *p<0.05 and **p<0.01 vs WT and Esp−/− +Alend (ANOVA). In (O, S), *p<0.05, **p<0.01 and ***p<0.001 vs GST group (t-test). In (P–R) *p<0.05, **p<0.01 and ***p<0.001 vs Normal diet and GST groups (ANOVA). See also Figure S6.
Figure 7
Figure 7. Insulin signaling in human osteoblasts and glucose homeostasis
(A) Western blot analysis of PTP1B expression in human and mouse osteoblasts (OSB). (B) Phosphorylation of InsR in human osteoblasts transfected with control (Con) or PTP1B siRNA. (C) Phosphorylation of FoxO1 in human osteoblasts transfected with control (Con) or PTP1B siRNA. (D) Real-time PCR analysis of Opg expression in human osteoblasts transfected with control siRNA (Con siRNA) or InsR siRNA or PTP1B siRNA. (E) Phosphorylation of FoxO1 in human osteoblasts transfected with control (Con) or INSR siRNA. (F) In vivo trapping of INSR by PTP1B DA mutant in human osteoblasts. (G) Insulin levels (90 min. post-feeding) and osteocalcin carboxylation ratio assessed by dual ELISA in human patients affected with dominant osteopetrosis (ADO) and normal controls. (H) Model of the bone resorption-dependent activation of osteocalcin by InsR. Insulin signaling in osteoblasts, which is inhibited by Esp, decreases in a FoxO1-dependent manner Opg expression. This promotes bone resorption and in particular Tcigr1 expression and acidification of the bone ECM, which promotes osteocalcin decarboxylation and as a result β-cells proliferation, insulin secretion and insulin sensitivity. See also Figure S7.

Comment in

References

    1. Bluher M, Michael MD, Peroni OD, Ueki K, Carter N, Kahn BB, Kahn CR. Adipose tissue selective insulin receptor knockout protects against obesity and obesity-related glucose intolerance. Dev Cell. 2002;3:25–38. - PubMed
    1. Bruning JC, Michael MD, Winnay JN, Hayashi T, Horsch D, Accili D, Goodyear LJ, Kahn CR. A muscle-specific insulin receptor knockout exhibits features of the metabolic syndrome of NIDDM without altering glucose tolerance. Mol Cell. 1998;2:559–569. - PubMed
    1. Chengalvala MV, Bapat AR, Hurlburt WW, Kostek B, Gonder DS, Mastroeni RA, Frail DE. Biochemical characterization of osteo-testicular protein tyrosine phosphatase and its functional significance in rat primary osteoblasts. Biochemistry. 2001;40:814–821. - PubMed
    1. Cousin W, Courseaux A, Ladoux A, Dani C, Peraldi P. Cloning of hOST-PTP: the only example of a protein-tyrosine-phosphatase the function of which has been lost between rodent and human. Biochem Biophys Res Commun. 2004;321:259–265. - PubMed
    1. Dacquin R, Mee PJ, Kawaguchi J, Olmsted-Davis EA, Gallagher JA, Nichols J, Lee K, Karsenty G, Smith A. Knock-in of nuclear localised beta-galactosidase reveals that the tyrosine phosphatase Ptprv is specifically expressed in cells of the bone collar. Dev Dyn. 2004;229:826–834. - PubMed