. 2010 Jul 7;99(1):29-39.
doi: 10.1016/j.bpj.2010.03.058.

The potential landscape of genetic circuits imposes the arrow of time in stem cell differentiation

Affiliations

The potential landscape of genetic circuits imposes the arrow of time in stem cell differentiation

Jin Wang et al. Biophys J. .

Abstract

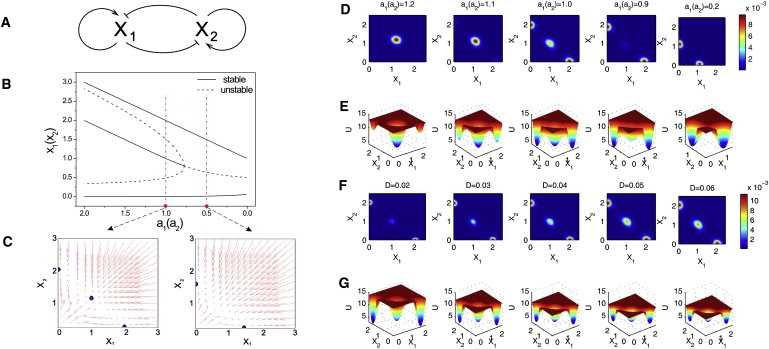
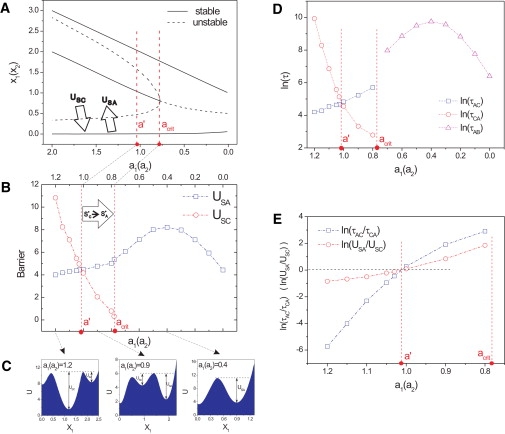
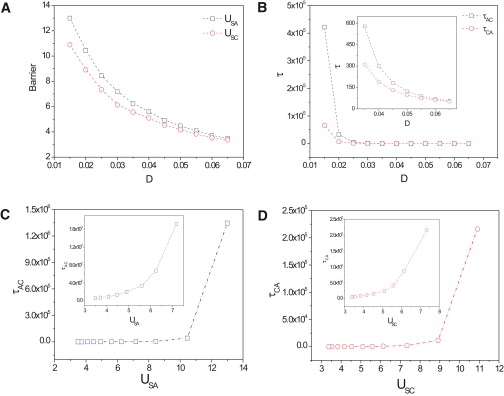
Differentiation from a multipotent stem or progenitor state to a mature cell is an essentially irreversible process. The associated changes in gene expression patterns exhibit time-directionality. This "arrow of time" in the collective change of gene expression across multiple stable gene expression patterns (attractors) is not explained by the regulated activation, the suppression of individual genes which are bidirectional molecular processes, or by the standard dynamical models of the underlying gene circuit which only account for local stability of attractors. To capture the global dynamics of this nonequilibrium system and gain insight in the time-asymmetry of state transitions, we computed the quasipotential landscape of the stochastic dynamics of a canonical gene circuit that governs branching cell fate commitment. The potential landscape reveals the global dynamics and permits the calculation of potential barriers between cell phenotypes imposed by the circuit architecture. The generic asymmetry of barrier heights indicates that the transition from the uncommitted multipotent state to differentiated states is inherently unidirectional. The model agrees with observations and predicts the extreme conditions for reprogramming cells back to the undifferentiated state.


Figures

Figure 1
Figure 1
Dynamics of the canonical gene regulatory circuit of two mutually opposing transcription factors that positively self-regulate themselves. (A) Circuit architecture for the two genes X1 and X2. (B) Bifurcation diagrams indicating the stable position of S(x1, x2) where x1 = x2 for the symmetric case (vertical axis), during the symmetric change of a = a1 = a2 over the indicated range of values (horizontal axis), for the other parameter values b1 = b2 = 1, k1 = k2 = 1, and S = 0.5, n = 4. (C) Force field in the X1X2 state space for two parameter values for parameter a on both sides of the respective critical point in the bifurcation diagram. (D and F) Steady-state probability distribution Pss(S) calculated from the Fokker-Planck equation (Eq. 1) as function of the parameter a in panel D or the noise parameter D in panel F. Colors indicate the probability P as shown in the color bar. (E and G) The corresponding quasipotential landscape where the elevation of the landscape (quasipotential) represents –ln(P(S)).
Figure 2
Figure 2
Dynamical behavior of the probability P(S, t) and flux vectors during fate decision of a stem cell in the multipotent state SC. P(S, t) is evaluated during bifurcation from tristable to the bistable regime as the parameters a1 and a2 are decreased according to a1 ∼ exp(–λ1t) and a2 ∼ exp(–λ2t) with λ1 = 0.01 and λ2 = 0.015. In panel A, the initial state is near the central attractor SC, P(S = (0.3, 0.3), t = 0) = 1, whereas in panel B, the initial state is near the attractor SA, i.e., P(S(1.0, 0.0), t = 0) = 1. Other parameters are the same as Fig. 1.
Figure 3
Figure 3
Relative barrier height as a function of parameter a accounts for directionality of state transitions around the bifurcation. (A) The bifurcation diagram for same parameters as in Fig. 1B with large arrows representing the transitions across the respective barriers USC and USA that separate the central stem cell attractors SC and the differentiated cell attractors SA and SB. (B) Computed heights of the barriers USC and USA as a function of a = a1 = a2 (for noise level D = 0.05). Here acrit = bifurcation point, a′= value of a at which the relative barrier heights reverse. (C) Sections through the potential landscape illustrating the barriers at the three indicated values of a (dashed arrows). (D) The transitions mean first passage times τ for SCSA (τCA) and SASC (τAC). (E) Direct comparison of U and τ as function of a: log-scale relative barrier heights or transition times for the transitions SASC and SCSA, respectively. Other parameters are the same as Fig. 1.
Figure 4
Figure 4
Dependence from the noise level D of barrier heights U and state transition times τ (A and B) and their equivalence (C and D), regime a = 1. The values τAC, τAB, and τCA denote the transition times (given a noise level D) for noise-driven transitions between the respective attractors, and USA and USC represent the barrier heights separating the respective attractors. Here a1 = a2 = 1 (other parameters the same as Fig. 1).

References

    1. Akashi K., He X., Li L. Transcriptional accessibility for genes of multiple tissues and hematopoietic lineages is hierarchically controlled during early hematopoiesis. Blood. 2003;101:383–389. - PubMed
    1. Bruno L., Hoffmann R., Enver T. Molecular signatures of self-renewal, differentiation, and lineage choice in multipotential hemopoietic progenitor cells in vitro. Mol. Cell. Biol. 2004;24:741–756. - PMC - PubMed
    1. Huang S. Endothelial Biomedicine. Cambridge University Press; New York: 2007. Cell fates as attractors—stability and flexibility of cellular phenotype.
    1. Smith L., Greenfield A. DNA microarrays and development. Hum. Mol. Genet. 2003;12:R1–R8. - PubMed
    1. Kloc M., Zagrodzinska B. Chromatin elimination—an oddity or a common mechanism in differentiation and development? Differentiation. 2001;68:84–91. - PubMed

Publication types