

Expression and physiological role of three Myxococcus xanthus copper-dependent P1B-type ATPases during bacterial growth and development
- PMID: 20656859
- PMCID: PMC2937514
- DOI: 10.1128/AEM.00755-10
Expression and physiological role of three Myxococcus xanthus copper-dependent P1B-type ATPases during bacterial growth and development
Abstract
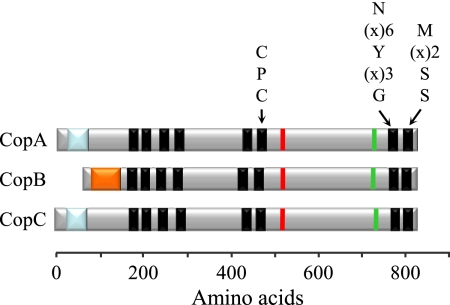
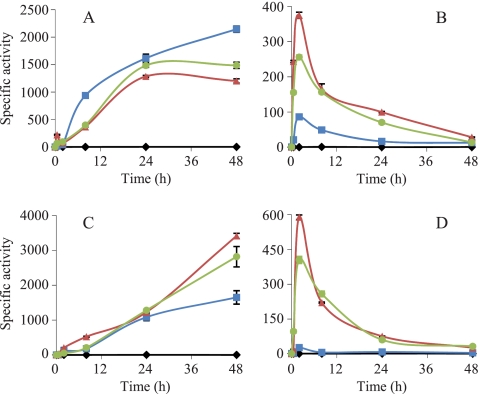
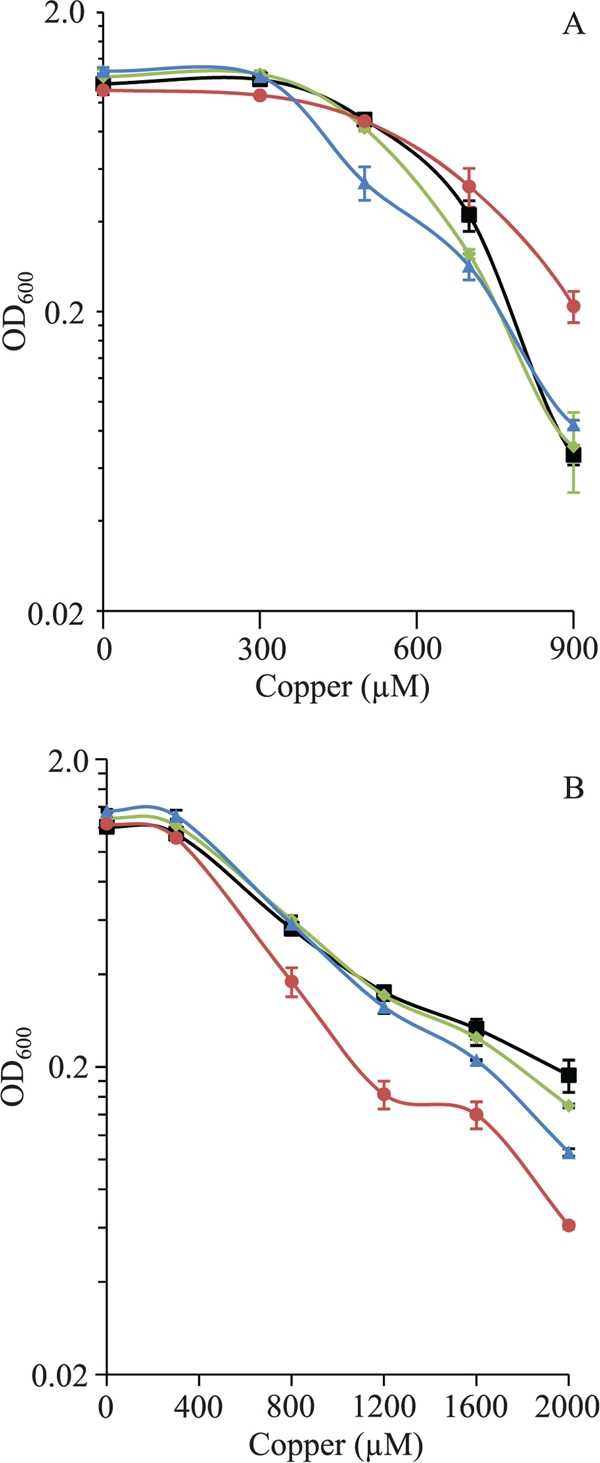
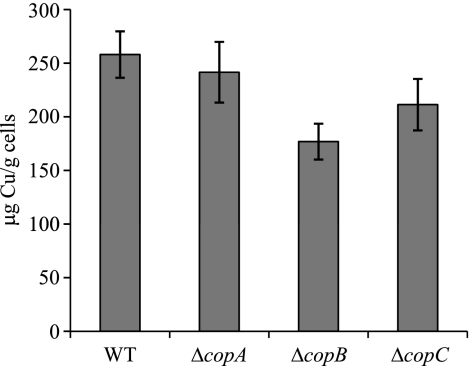
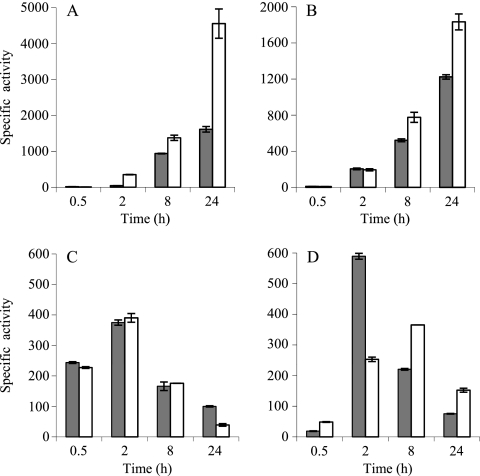
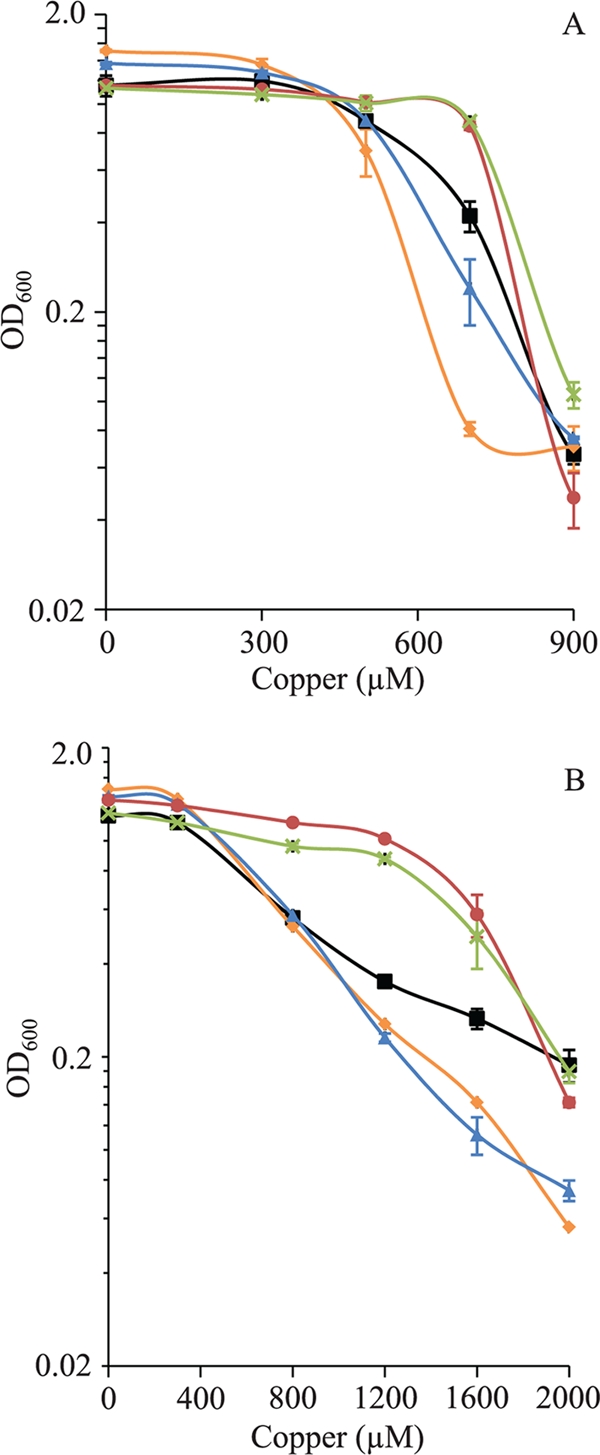
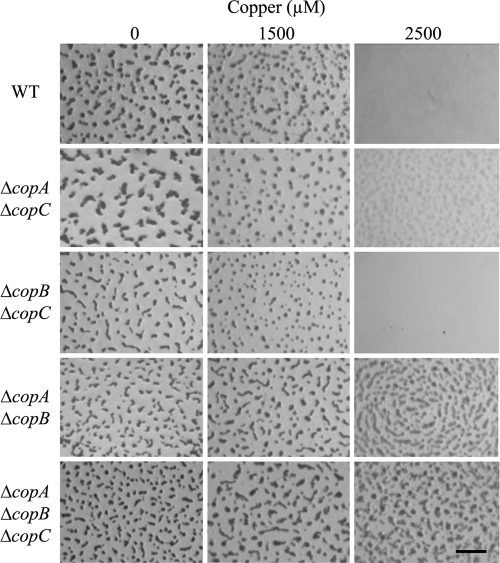
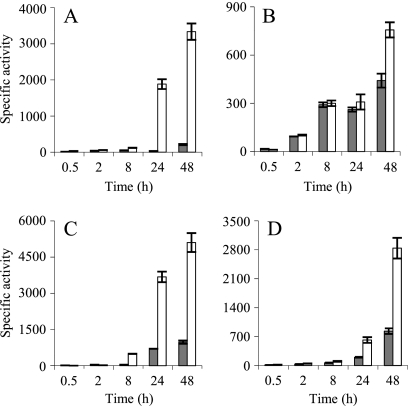
Myxococcus xanthus is a soil-dwelling bacterium that exhibits a complex life cycle comprising social behavior, morphogenesis, and differentiation. In order to successfully complete this life cycle, cells have to cope with changes in their environment, among which the presence of copper is remarkable. Copper is an essential transition metal for life, but an excess of copper provokes cellular damage by oxidative stress. This dual effect forces the cells to maintain a tight homeostasis. M. xanthus encodes a large number of genes with similarities to others reported previously to be involved in copper homeostasis, most of which are redundant. We have identified three genes that encode copper-translocating P(1B)-ATPases (designated copA, copB, and copC) that exhibit the sequence motifs and modular organizations of those that extrude Cu(+). The expression of the ATPase copC has not been detected, but copA and copB are differentially regulated by the addition of external copper. However, while copB expression peaks at 2 h, copA is expressed at higher levels, and the maximum is reached much later. The fact that these expression profiles are nearly identical to those exhibited by the multicopper oxidases cuoA and cuoB suggests that the pairs CuoB-CopB and CuoA-CopA sequentially function to detoxify the cell. The deletion of any ATPase alters the expression profiles of other genes involved in copper homeostasis, such as the remaining ATPases or the Cus systems, yielding cells that are more resistant to the metal.
Figures
Similar articles
-
Differential regulation of six heavy metal efflux systems in the response of Myxococcus xanthus to copper.Appl Environ Microbiol. 2010 Sep;76(18):6069-76. doi: 10.1128/AEM.00753-10. Epub 2010 Jun 18. Appl Environ Microbiol. 2010. PMID: 20562277 Free PMC article.
-
The ATPases CopA and CopB both contribute to copper resistance of the thermoacidophilic archaeon Sulfolobus solfataricus.Microbiology (Reading). 2012 Jun;158(Pt 6):1622-1633. doi: 10.1099/mic.0.055905-0. Epub 2012 Feb 23. Microbiology (Reading). 2012. PMID: 22361944
-
Differential expression of the three multicopper oxidases from Myxococcus xanthus.J Bacteriol. 2007 Jul;189(13):4887-98. doi: 10.1128/JB.00309-07. Epub 2007 May 4. J Bacteriol. 2007. PMID: 17483223 Free PMC article.
-
The complex global response to copper in the multicellular bacterium Myxococcus xanthus.Metallomics. 2018 Jul 18;10(7):876-886. doi: 10.1039/c8mt00121a. Metallomics. 2018. PMID: 29961779 Review.
-
[Structure and function of ATP7A and ATP7B proteins--Cu-transporting ATPases].Postepy Biochem. 2010;56(3):317-27. Postepy Biochem. 2010. PMID: 21117320 Review. Polish.
Cited by
-
Antimicrobial Activity of Metals and Metalloids.Annu Rev Microbiol. 2021 Oct 8;75:175-197. doi: 10.1146/annurev-micro-032921-123231. Epub 2021 Aug 3. Annu Rev Microbiol. 2021. PMID: 34343021 Free PMC article. Review.
-
In depth analysis of the mechanism of action of metal-dependent sigma factors: characterization of CorE2 from Myxococcus xanthus.Nucleic Acids Res. 2016 Jul 8;44(12):5571-84. doi: 10.1093/nar/gkw150. Epub 2016 Mar 6. Nucleic Acids Res. 2016. PMID: 26951374 Free PMC article.
-
The NmpRSTU multi-component signaling system of Myxococcus xanthus regulates expression of an oxygen utilization regulon.J Bacteriol. 2025 Feb 20;207(2):e0028024. doi: 10.1128/jb.00280-24. Epub 2025 Jan 27. J Bacteriol. 2025. PMID: 39868781 Free PMC article.
-
Comprehensive set of integrative plasmid vectors for copper-inducible gene expression in Myxococcus xanthus.Appl Environ Microbiol. 2012 Apr;78(8):2515-21. doi: 10.1128/AEM.07502-11. Epub 2012 Jan 27. Appl Environ Microbiol. 2012. PMID: 22287008 Free PMC article.
-
Copper and Melanin Play a Role in Myxococcus xanthus Predation on Sinorhizobium meliloti.Front Microbiol. 2020 Feb 4;11:94. doi: 10.3389/fmicb.2020.00094. eCollection 2020. Front Microbiol. 2020. PMID: 32117124 Free PMC article.
References
-
- Argüello, J. M., E. Eren, and M. Gonzalez-Guerrero. 2007. The structure and function of heavy metal transport P1B-ATPases. Biometals 20:233-248. - PubMed
-
- Cavet, J. S., G. P. Borrelly, and N. J. Robinson. 2003. Zn, Cu and Co in cyanobacteria: selective control of metal availability. FEMS Microbiol. Rev. 27:165-181. - PubMed
-
- Changela, A., K. Chen, Y. Xue, J. Holschen, C. E. Outten, T. V. O'Halloran, and A. Mondragon. 2003. Molecular basis of metal-ion selectivity and zeptomolar sensitivity by CueR. Science 301:1383-1387. - PubMed
-
- Cho, K., and D. R. Zusman. 1999. AsgD, a new two-component regulator required for A-signalling and nutrient sensing during early development of Myxococcus xanthus. Mol. Microbiol. 34:268-281. - PubMed
-
- Espariz, M., S. K. Checa, M. E. Audero, L. B. Pontel, and F. C. Soncini. 2007. Dissecting the Salmonella response to copper. Microbiology 153:2989-2997. - PubMed
Publication types
MeSH terms
Substances
LinkOut - more resources
Full Text Sources
