

An integrative approach to genomic introgression mapping
- PMID: 20656899
- PMCID: PMC2938162
- DOI: 10.1104/pp.110.158949
An integrative approach to genomic introgression mapping
Abstract
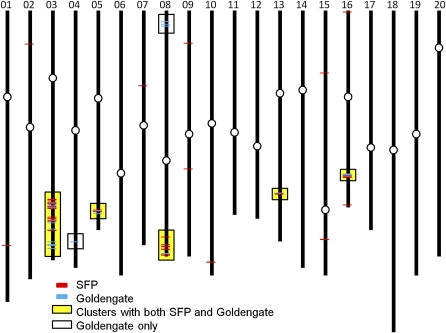
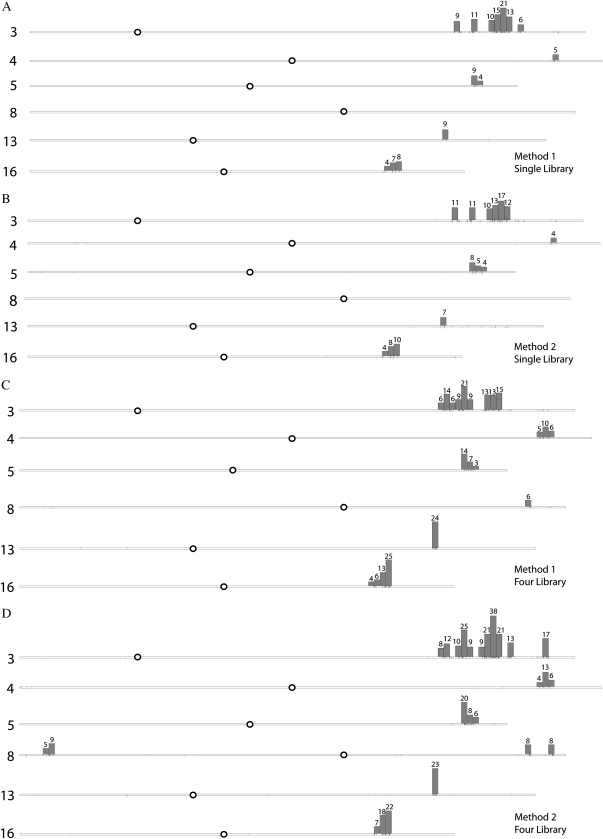
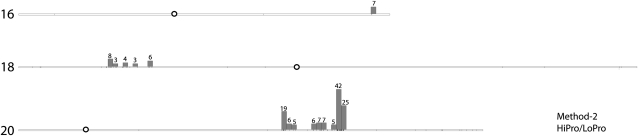
Near-isogenic lines (NILs) are valuable genetic resources for many crop species, including soybean (Glycine max). The development of new molecular platforms promises to accelerate the mapping of genetic introgressions in these materials. Here, we compare some existing and emerging methodologies for genetic introgression mapping: single-feature polymorphism analysis, Illumina GoldenGate single nucleotide polymorphism (SNP) genotyping, and de novo SNP discovery via RNA-Seq analysis of next-generation sequence data. We used these methods to map the introgressed regions in an iron-inefficient soybean NIL and found that the three mapping approaches are complementary when utilized in combination. The comparative RNA-Seq approach offers several additional advantages, including the greatest mapping resolution, marker depth, and de novo marker utility for downstream fine-mapping analysis. We applied the comparative RNA-Seq method to map genetic introgressions in an additional pair of NILs exhibiting differential seed protein content. Furthermore, we attempted to optimize the comparative RNA-Seq approach by assessing the impact of sequence depth, SNP identification methodology, and post hoc analyses on SNP discovery rates. We conclude that the comparative RNA-Seq approach can be optimized with sufficient sampling and by utilizing a post hoc correction accounting for gene density variation that controls for false discoveries.
Figures
References
-
- Bernard RL, Nelson RL, Cremeens CR. (1991) USDA Soybean Genetic Collection: isoline collection. Soybean Genet Newsl 18: 27–57
-
- Ding C, Jin S. (2009) High-throughput methods for SNP genotyping. Methods Mol Biol 578: 245–254 - PubMed
-
- Eid J, Fehr A, Gray J, Luong K, Lyle J, Otto G, Peluso P, Rank D, Baybayan P, Bettman B, et al. (2009) Real-time DNA sequencing from single polymerase molecules. Science 323: 133–138 - PubMed
-
- Fu Y, Springer NM, Gerhardt DJ, Ying K, Yeh CT, Wu W, Swanson-Wagner R, D’Ascenzo M, Millard T, Freeberg L, et al. (2010) Repeat subtraction-mediated sequence capture from a complex genome. Plant J 62: 898–909 - PubMed
Publication types
MeSH terms
LinkOut - more resources
Full Text Sources
Molecular Biology Databases
