Comparative Study
. 2010 Sep 1;185(5):2968-79.
doi: 10.4049/jimmunol.1000805. Epub 2010 Jul 23.

Distinct cell death programs in monocytes regulate innate responses following challenge with common causes of invasive bacterial disease

Affiliations
Comparative Study

Distinct cell death programs in monocytes regulate innate responses following challenge with common causes of invasive bacterial disease

Steve J Webster et al. J Immunol. .

Abstract

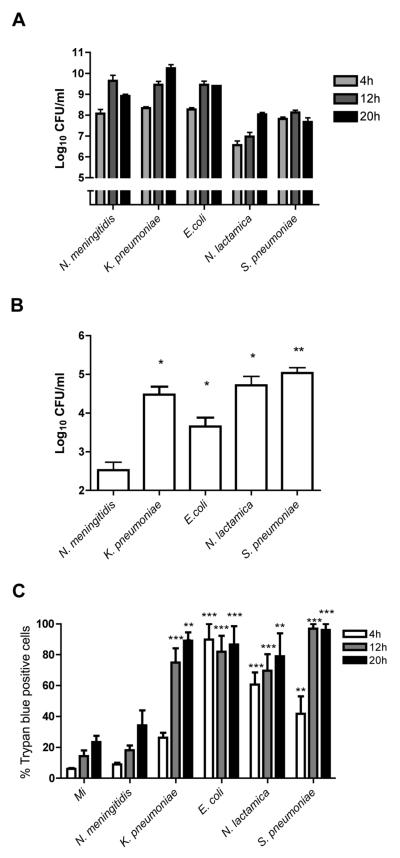
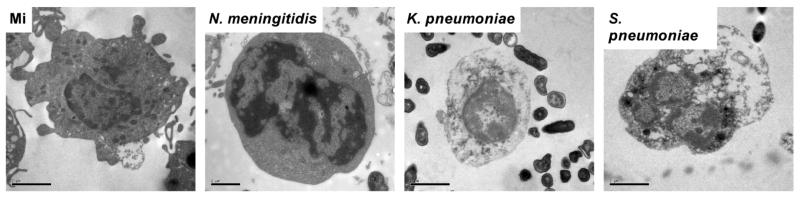
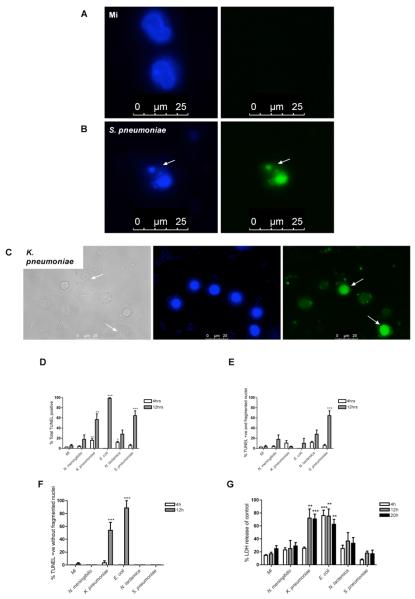
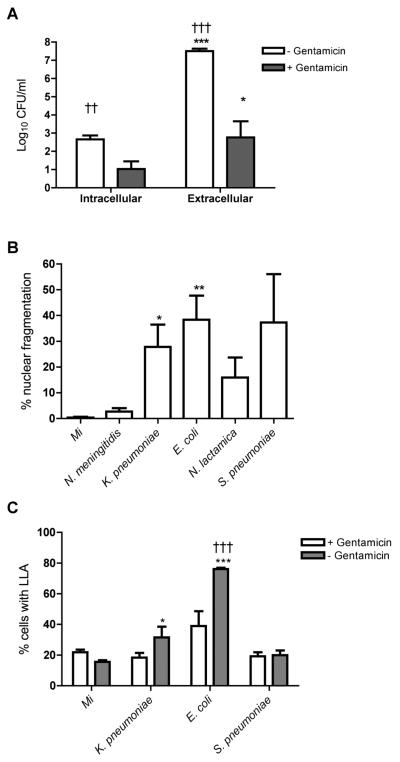
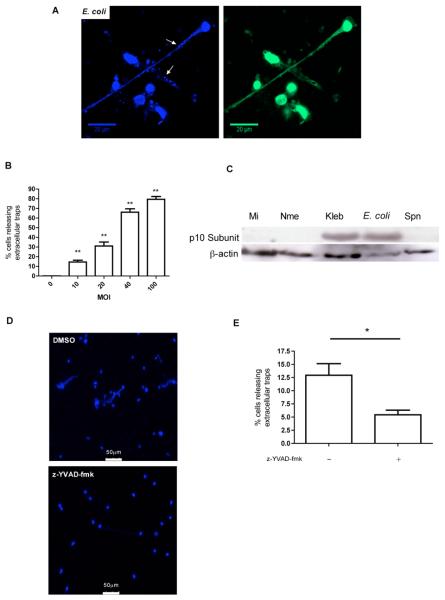
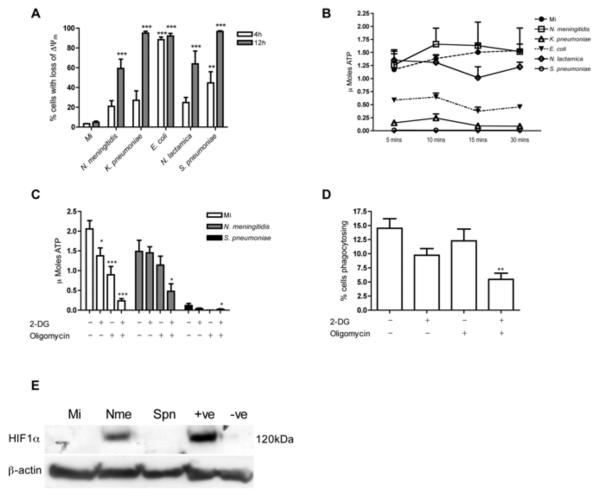
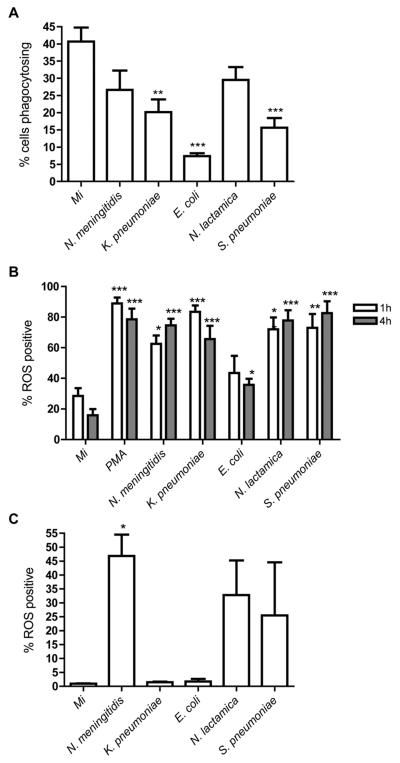
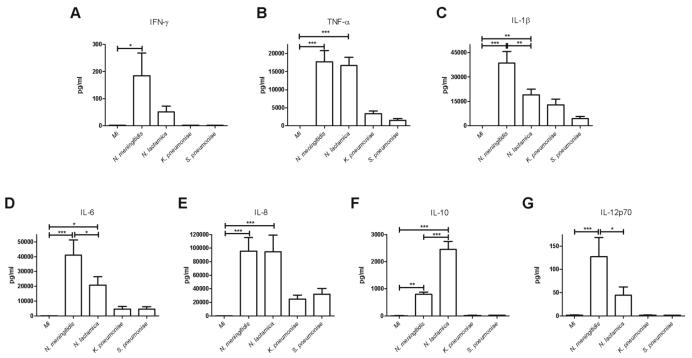
Peripheral blood monocytes represent the rapid response component of mononuclear phagocyte host defense, generating vigorous but finite antibacterial responses. We investigated the fate of highly purified primary human monocytes following phagocytosis of different bacteria. Exposure to high bacterial loads resulted in rapid loss of cell viability and decreased functional competence. Cell death typically involved classical apoptosis. Exposure to high numbers of Escherichia coli and Klebsiella pneumoniae induced nonapoptotic death with loss of cell membrane integrity, marked disruption of phagolysosomes, and caspase-1 activation, while a subset of cells also released caspase-1-regulated extracellular traps. Classical apoptosis increased if extracellular bacterial replication was reduced and decreased if intracellular ATP levels were reduced during these infections. Both classical apoptosis and the alternative forms of cell death allowed monocytes, whose functional competence was exhausted, to downregulate reactive oxygen species and proinflammatory cytokine responses. In contrast, sustained stimulation of glycolytic metabolism and mitochondrial oxidative phosphorylation, with associated hypoxia inducible factor-1alpha upregulation, maintained intracellular ATP levels and prolonged monocyte functional longevity, as assessed by maintenance of phagocytosis, reactive oxygen species production, and proinflammatory cytokine generation. Monocyte innate responses to bacteria are short-lived and are limited by an intrinsic program of apoptosis, a response that is subverted by overwhelming infection with E. coli and K. pneumoniae or bacterial stimulation of cell metabolism. In this regard, the fate of monocytes following bacterial challenge more closely resembles neutrophils than macrophages.


Figures

Figure 1
Figure 1. Bacterial challenge results in loss of monocyte viability
Monocytes were mock infected (Mi) or exposed to the indicted bacteria at an MOI of 10 for 4, 12 or 20 h and (A) Extracellular colony forming units (CFU) were estimated (B) Intracellular colony counts were estimated at 4h by gentamicin killing assay and (C) Monocyte trypan blue exclusion assessed by brightfield microscopy. The percentage of cells staining positive with trypan blue are indicated, n=4 per group, * p< 0.05, **p<0.01, *** p<0.001, all comparisons vs. Mi by ANOVA with Dunnett's post-test comparison.
Figure 2
Figure 2. Nuclear morphology by transmission electron microscopy in monocytes exposed to bacteria
Representative transmission electron microscopy images of monocytes, stained with toluidine blue, following mock infection (original magnification ×11,500) or infection with N. meningitidis (original magnification ×14,000), K. pneumoniae (original magnification ×11,500) or S. pneumoniae (original magnification ×11,500) at an MOI of 10 for 12h obtained using a FEI Tecnai Transmission Electron Microscope.
Figure 3
Figure 3. Varying forms of cell death are observed in monocytes exposed to bacteria
(A-B) Representative fluorescent images of DAPI (blue images) and TUNEL (green images) stained monocytes following mock infection (A) or exposure to S. pneumoniae (B) at an MOI of 10 for 12h. The arrow illustrates a fragmented nucleus. (C) Representative brightfield (greyscale image) or fluorescent images of DAPI (blue image) and TUNEL (green image) stained monocytes following K. pneumoniae infection at an MOI of 10 for 12h. Arrows indicate cells showing membrane rupture and TUNEL positive nuclei without fragmentation. All images were obtained with a Zeiss LSM 510 confocal microscope with a Zeiss 63×/1.4 oil objective. (D-F) Following mock infection or exposure to N. meningitidis, K. pneumoniae, E. coli, N. lactamica, or S. pneumoniae at an MOI of 10 for 4 and 12 h, monocytes were stained with TUNEL and DAPI and observed using fluorescence microscopy. The total percentage of TUNEL positive monocytes (D), the percentage of TUNEL positive monocytes with fragmented nuclei (E) and the percentage of TUNEL positive monocytes without fragmented nuclei (F) were recorded, n=3. (G) Monocytes were mock infected or exposed to bacteria, as above, and the percentage LDH release compared to positive control at each time point, n=4 per group, * p< 0.05, **p<0.01, *** p<0.001, all comparisons vs. mock infected by ANOVA with Dunnett's post-test comparison. Bacterial colony forming units in these experiments are shown in the supplemental table 1A. MI, mock infected; +ve positive.
Figure 4
Figure 4. Large numbers of K. pneumoniae and E. coli cause cell death with features distinct from classical apoptosis
(A) The intracellular and extracellular colony forming units (CFU) per ml of monocyte culture lysate or culture supernatant were estimated 6h after exposure to E. coli in the presence or absence of gentamicin added 2h post infection. n=4, * p<0.05, *** p<0.001, unpaired t test comparing extracellular vs. intracellular; †† p<0.01, ††† p<0.001, unpaired t test comparing with gentamicin vs. without gentamicin. (B) Monocytes were mock infected (Mi) or exposed to N. meningitidis, K. pneumoniae, E. coli, N. lactamica, or S. pneumoniae at an MOI of 10 and gentamicin was added at 4h post infection. The percentage of monocytes with fragmented nuclei was recorded at 12h, n=3, * p<0.05, ** p<0.01, ANOVA with Dunnett's post-test vs. Mi. (C) Monocytes were mock infected or exposed to bacteria as in (B) in the presence or absence of gentamicin, added 1h post-infection. The percentage of monocytes with loss of lysosomal acidification (LLA) was recorded at 4h by flow cytometry, n=4, *p<0.05, *** p<0.001, ANOVA with Dunnett's post-test vs. Mi; ††† p<0.001 two-way ANOVA with Bonferroni post-test with gentamicin vs. without gentamicin.
Figure 5
Figure 5. E. coli can trigger extracellular trap release from monocytes
(A) Representative fluorescent image of DNA stained with Hoechst 33342 and anti-histone Ab H2A.Z 1h post infection with E. coli at an MOI of 10. Arrows indicate bacteria trapped in extracellular DNA. The image was obtained with a Zeiss LSM 510 confocal microscope with a Zeiss x63/1.4 oil objective. (B) Percentage of monocytes releasing extracellular traps 1h after challenge with E. coli at the indicated MOIs n=3, *p<0.05, ** p<0.01, ANOVA with Dunnett's post-test vs. MOI =0. (C) Western blot probed for the active p10 sub-unit of caspase-1 and β-actin from monocytes 12h after mock infection (Mi) or N. meningitidis (Nme), K. pneumoniae (Kpn), E. coli (Eco), or S. pneumoniae (Spn) infection at an MOI of 10. The blot is representative of three independent experiments. (D) Representative fluorescent images of DNA stained with Hoechst 33342 1h after infection with E. coli at an MOI of 10 in the presence or absence of the caspase 1 inhibitor z-YVAD-fmk. The images were obtained using a Leica DMRB microscope with a x40/0.7 objective. (E) Percentage of monocytes releasing extracellular traps 1h after infection with E. coli in the presence or absence of the caspase 1 inhibitor z-YVAD-fmk, n=4, * p<0.05, (Students t-test).
Figure 6
Figure 6. Monocytes exposed to N. meningitidis preserve intracellular ATP levels and retain phagocytic capacity
(A) Monocytes were mock infected (Mi) or exposed to N. meningitidis, K. pneumoniae, E. coli, N. lactamica, or S. pneumoniae at an MOI of 10 and at 4 or 12h the percentage of cells with loss of inner-mitochondrial transmembrane potential (Δψm) was estimated by flow cytometry n=6, **p<0.01, ***p<0.001 vs. Mi, ANOVA with Dunnett's post-test. (B) Monocytes were mock infected or exposed to bacteria as in (A) and 12h post infection intracellular ATP levels were estimated by bioluminescence. K. pneumoniae (5min, p<0.01), S. pneumoniae (5min p<0.001) and E. coli (10min, p<0.05) were significantly different to Mi. At 30min there was no significant difference between N. meningitidis or N. lactamica and Mi n=3, two-way ANOVA with Bonferroni post-test (C) Monocytes were mock infected or challenged with N. meningitidis or S. pneumoniae at an MOI of 10 for 12h. For the last 30 min of incubation 2-deoxyglucose (2-DG) and/or oligomycin was added to the indicated wells prior to lysis and intracellular ATP levels were estimated by bioluminescence, n=6, * p<0.05, *** p<0.001, all comparisons vs. samples without inhibitors for that infection, ANOVA with Dunnett's post-test. (D) The percent monocytes phagocytosing opsonised fluorescent latex beads 1h following treatment with or without 2-DG and oligomycin, as in (C), n=3, ** p<0.01 vs. samples without inhibitors, ANOVA with Dunnett's post-test. (E) Representative Western blot probed for hypoxia-inducible factor 1α (HIF-1α) and β-actin from monocytes following 12h mock infection or exposure to N. meningitidis (Nme) or S. pneumoniae (Spn) at an MOI of 10. The positive control (+ve) was a lysate from MCF-7 cells cultured in normoxia and the negative control (−ve) a lysate from MCF-7 cells cultured in hypoxia. The blot is representative of three independent experiments. Bacterial colony forming units (CFU) in these experiments are shown in supplementary Table 1B. −ve, negative control; +ve, positive control.
Figure 7
Figure 7. N. meningitidis exposed monocytes demonstrate sustained phagocytosis and production of reactive oxygen species (ROS)
(A) The percent monocytes phagocytosing opsonised fluorescent latex beads following 12h mock infection (Mi) or exposure to N. meningitidis, K. pneumoniae, E. coli, N. lactamica, or S. pneumoniae, at an MOI of 10 n=6, ** p<0.01, *** p<0.001 vs. Mi, ANOVA with Dunnett's post-test. The percentage of monocytes with detectable intracellular reactive oxygen species (ROS) (B) 1-4h and (C) 12h after mock infection (Mi) or exposure to N. meningitidis, K. pneumoniae, E. coli, N. lactamica, or S. pneumoniae, MOI=10. ROS was measured by flow cytometry following incubation with 2′, 7′-dichloro-dihydrofluorescein diacetate (DCF). n=3* p<0.05, ANOVA with Dunnett's post-test. Bacterial colony forming units (CFU) in these experiments are shown in supplementary Table 1B
Figure 8
Figure 8. Sustained pro-inflammatory cytokine production by monocytes exposed to N. meningitidis
Cytokine production by monocytes 12h after mock infection (Mi) or exposure to N. meningitidis, K. pneumoniae, N. lactamica, or S. pneumoniae at an MOI of 10. Cytokine levels in the culture media were determined by cytokine bead array (CBA); IFN-γ (A), TNF-α (B), IL-1β (C), IL-6 (D), IL-8 (E), IL-10 (F) and IL-12p70 (G). n=8, * p<0.05, ** p<0.01, *** p<0.001, ANOVA with Tukey's post-test.

References

    1. Serbina NV, Jia T, Hohl TM, Pamer EG. Monocyte-mediated defense against microbial pathogens. Annu Rev Immunol. 2008;26:421–452. - PMC - PubMed
    1. Gordon S, Taylor PR. Monocyte and macrophage heterogeneity. Nat Rev Immunol. 2005;5:953–964. - PubMed
    1. Mosser DM, Edwards JP. Exploring the full spectrum of macrophage activation. Nat Rev Immunol. 2008;8:958–969. - PMC - PubMed
    1. North RJ. The relative importance of blood monocytes and fixed macrophages to the expression of cell-mediated immunity to infection. J Exp Med. 1970;132:521–534. - PMC - PubMed
    1. Steigbigel RT, Lambert LH, Jr., Remington JS. Phagocytic and bacterial properties of normal human monocytes. J Clin Invest. 1974;53:131–142. - PMC - PubMed

Publication types

MeSH terms