

Spatio-temporal oscillations of individual mitochondria in cardiac myocytes reveal modulation of synchronized mitochondrial clusters
- PMID: 20656937
- PMCID: PMC2922526
- DOI: 10.1073/pnas.1007562107
Spatio-temporal oscillations of individual mitochondria in cardiac myocytes reveal modulation of synchronized mitochondrial clusters
Abstract
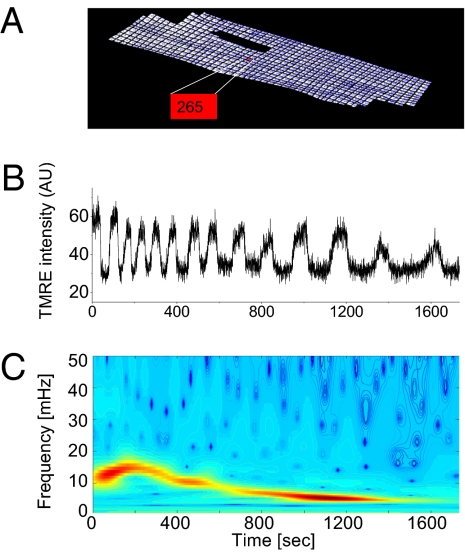
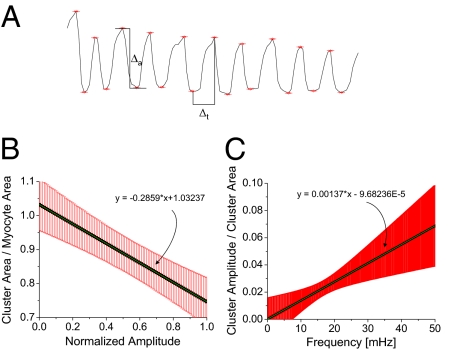
Mitochondrial networks in cardiac myocytes under oxidative stress show collective (cluster) behavior through synchronization of their inner membrane potentials (DeltaPsi(m)). However, it is unclear whether the oscillation frequency and coupling strength between individual mitochondria affect the size of the cluster and vice versa. We used the wavelet transform and developed advanced signal processing tools that allowed us to capture individual mitochondrial DeltaPsi(m) oscillations in cardiac myocytes and examine their dynamic spatio-temporal properties. Heterogeneous frequency behavior prompted us to sort mitochondria according to their frequencies. Signal analysis of the mitochondrial network showed an inverse relationship between cluster size and cluster frequency as well as between cluster amplitude and cluster size. High cross-correlation coefficients between neighboring mitochondria clustered longitudinally along the myocyte striations, indicated anisotropic communication between mitochondria. Isochronal mapping of the onset of myocyte-wide DeltaPsi(m) depolarization further exemplified heterogeneous DeltaPsi(m) among mitochondria. Taken together, the results suggest that frequency and amplitude modulation of clusters of synchronized mitochondria arises by means of strong changes in local coupling between neighboring mitochondria.
Conflict of interest statement
The authors declare no conflict of interest.
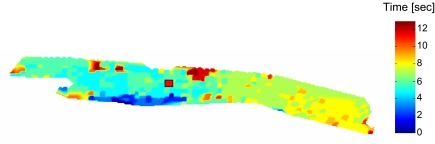
Figures
 ) is marked with a horizontal dashed line and the relevant cluster peak
  (in red) extends to frequencies defined by
  and
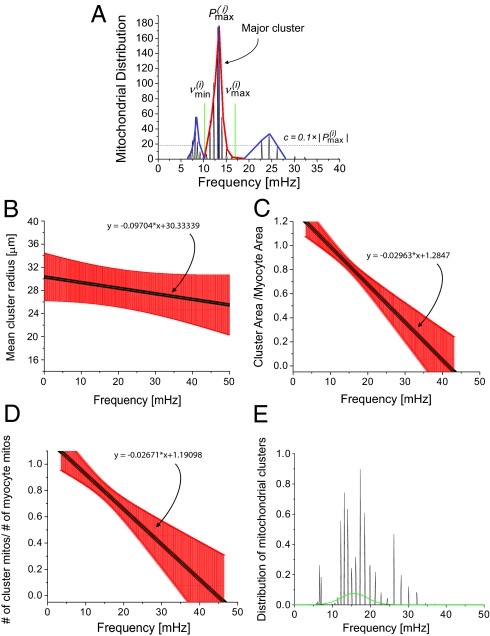
and  (green lines). Because the correlation of the other two clusters peaks (in blue) with the major cluster peak is lower than 95%, the major cluster peak does not include these smaller clusters. (B) Mean cluster radius as a function of frequency. (C) Cluster area normalized by the full myocyte area as a function of frequency. (D) Cluster mitochondria count normalized by the total number of mitochondria for the major cluster as a function of frequency. SE bars are in red and the mean curve is in black. (E) Distribution of mitochondrial frequencies for all cluster mitochondria across all myocytes.
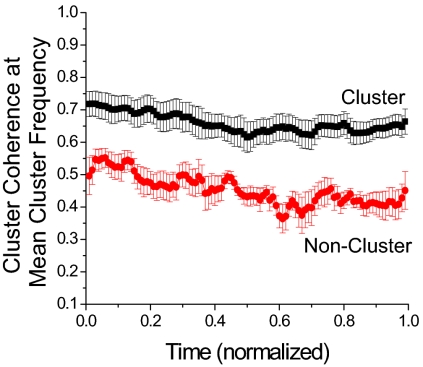
References
-
- O'Rourke BR, Ramza BM, Marban E. Oscillations of membrane current and excitability driven by metabolic oscillations in heart cells. Science. 1994;265:962–966. - PubMed
-
- Aon MA, Cortassa S, Marbán E, O'Rourke B. Synchronized whole cell oscillations in mitochondrial metabolism triggered by a local release of reactive oxygen species in cardiac myocytes. J Biol Chem. 2003;278:44735–44744. - PubMed
Publication types
MeSH terms
Grants and funding
LinkOut - more resources
Full Text Sources
Other Literature Sources
