Risk-sensitive optimal feedback control accounts for sensorimotor behavior under uncertainty
- PMID: 20657657
- PMCID: PMC2904762
- DOI: 10.1371/journal.pcbi.1000857
Risk-sensitive optimal feedback control accounts for sensorimotor behavior under uncertainty
Abstract
Many aspects of human motor behavior can be understood using optimality principles such as optimal feedback control. However, these proposed optimal control models are risk-neutral; that is, they are indifferent to the variability of the movement cost. Here, we propose the use of a risk-sensitive optimal controller that incorporates movement cost variance either as an added cost (risk-averse controller) or as an added value (risk-seeking controller) to model human motor behavior in the face of uncertainty. We use a sensorimotor task to test the hypothesis that subjects are risk-sensitive. Subjects controlled a virtual ball undergoing Brownian motion towards a target. Subjects were required to minimize an explicit cost, in points, that was a combination of the final positional error of the ball and the integrated control cost. By testing subjects on different levels of Brownian motion noise and relative weighting of the position and control cost, we could distinguish between risk-sensitive and risk-neutral control. We show that subjects change their movement strategy pessimistically in the face of increased uncertainty in accord with the predictions of a risk-averse optimal controller. Our results suggest that risk-sensitivity is a fundamental attribute that needs to be incorporated into optimal feedback control models.
Conflict of interest statement
The authors have declared that no competing interests exist.
Figures


 ), whereas it makes a movement strategy more desirable for a risk-seeking controller (
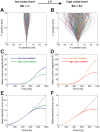
 ). As a consequence, the policy of the controller changes with the noise level N depending on its risk-attitude
  . A.–C. Changes in motor command with the state of the ball (its positional deviation
  from the center) for a low noise level (green) and for a high noise level (red) for the risk-neutral (A), risk-averse (B) and risk-seeking (C) controllers. The slope of the lines is equivalent to the control gain of the controller. D.–F. Contribution of control cost to total cost (control cost+error cost) for the risk-neutral (D), risk-averse (E) and risk-seeking (F) controllers.

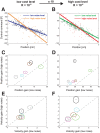
 -values. B. as A. but for the high control cost conditions. C. Subjects' individual risk-parameters
  inferred from the experimental data of the high cost level versus
  inferred from the data of the low cost level (ellipses show 1 s.d.).
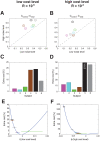
 -values of the multilinear regression analysis averaged across all subjects and conditions for different sensorimotor delays.
 ) for the low noise level (green) and for the high noise level (red). D.–F. Contribution of control cost to total cost (control cost+error cost). A. & D. - Predictions of a risk-neutral controller. B. & E. - Predictions of a risk-averse controller. C. & F. - Predictions of a risk-preferring controller.
 -parameters for the low cost level. D. as C. but for the high cost level. E. Relationship between extra cost of a risk-sensitive controller relative to a risk-neutral controller for a range of
  -values overlaid with the subjects' experimentally inferred
  -parameters
  standard deviation for the low cost level. F. as E. but for the high cost level.
References
-
- Binswanger H. Attitudes toward risk: Experimental measurement in rural India. Am J Agr Econ. 1980;62:395–407.
-
- Holt C, Laury S. Risk aversion and incentive effects. Am Econ Rev. 2002;92:1644–1655.
-
- Todorov E, Jordan MI. Optimal feedback control as a theory of motor coordination. Nat Neurosci. 2002;5:1226–35. - PubMed
Publication types
MeSH terms
Grants and funding
LinkOut - more resources
Full Text Sources

