. 2010 Jul 15;6(7):e1000859.
doi: 10.1371/journal.pcbi.1000859.

Sampling the solution space in genome-scale metabolic networks reveals transcriptional regulation in key enzymes

Affiliations

Sampling the solution space in genome-scale metabolic networks reveals transcriptional regulation in key enzymes

Sergio Bordel et al. PLoS Comput Biol. .

Abstract

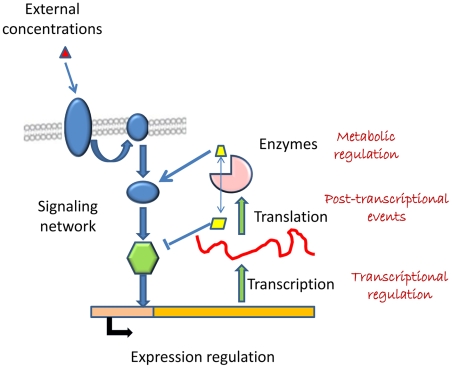
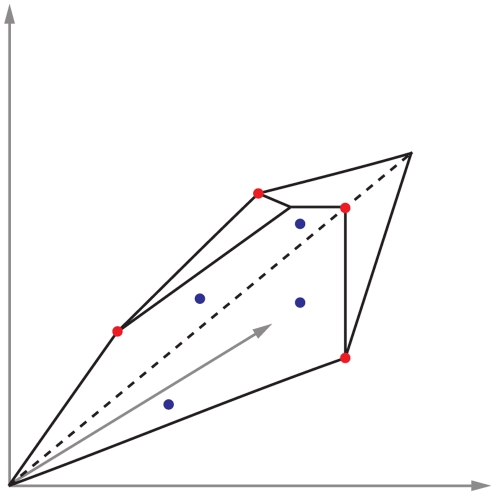
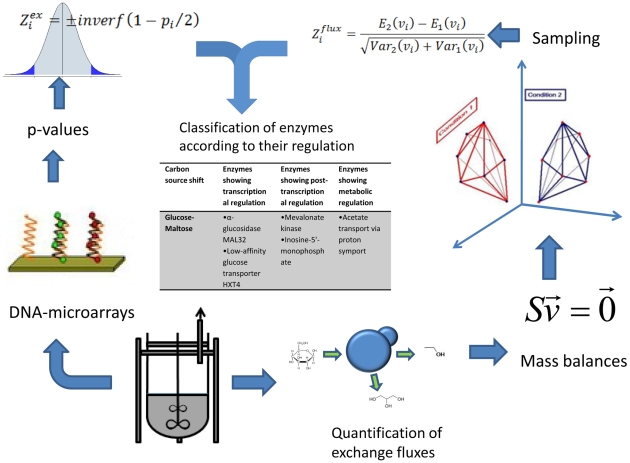
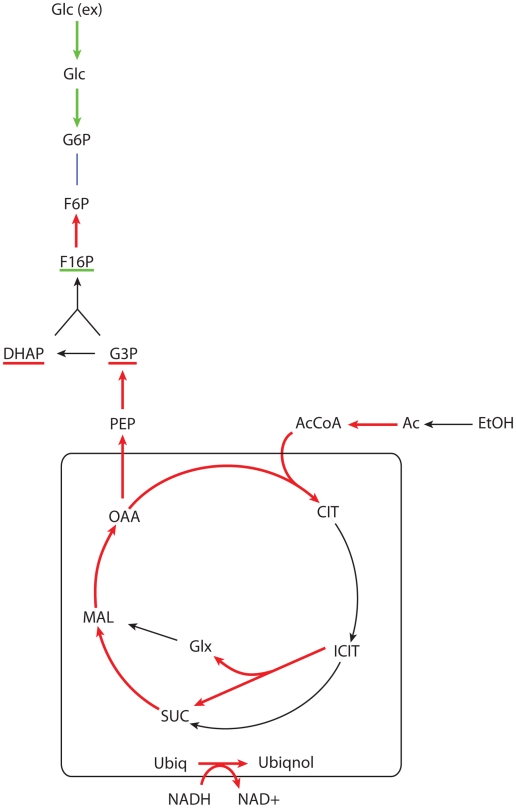
Genome-scale metabolic models are available for an increasing number of organisms and can be used to define the region of feasible metabolic flux distributions. In this work we use as constraints a small set of experimental metabolic fluxes, which reduces the region of feasible metabolic states. Once the region of feasible flux distributions has been defined, a set of possible flux distributions is obtained by random sampling and the averages and standard deviations for each of the metabolic fluxes in the genome-scale model are calculated. These values allow estimation of the significance of change for each reaction rate between different conditions and comparison of it with the significance of change in gene transcription for the corresponding enzymes. The comparison of flux change and gene expression allows identification of enzymes showing a significant correlation between flux change and expression change (transcriptional regulation) as well as reactions whose flux change is likely to be driven only by changes in the metabolite concentrations (metabolic regulation). The changes due to growth on four different carbon sources and as a consequence of five gene deletions were analyzed for Saccharomyces cerevisiae. The enzymes with transcriptional regulation showed enrichment in certain transcription factors. This has not been previously reported. The information provided by the presented method could guide the discovery of new metabolic engineering strategies or the identification of drug targets for treatment of metabolic diseases.


Conflict of interest statement

The authors have declared that no competing interests exist.

Figures

Figure 1
Figure 1. Illustration of the regulatory mechanisms of cellular metabolism.
The fluxes can be regulated at the level of mRNA transcription, by the concentrations of the metabolites or by intermediate steps such as translation or activation of the enzymes.
Figure 2
Figure 2. The red points illustrate the sampling in the corners of the region of allowed solutions.
The blue points illustrate the uniform random sampling inside the space of allowed solutions.
Figure 3
Figure 3. This figure illustrates the different steps of our method.
Two kinds of data are extracted from fermentations, gene expression data and production and consumption rates of different metabolites. The gene expression data are transformed into significance scores and p-values for the expression change of the metabolic genes. The measured fluxes are used to constrain the solution spaces corresponding to different conditions. A sampling among the allowed solutions gives averages and standard deviations for each reaction rate in the metabolic network. These values can be obtained to obtain significance scores and p-values for the changes in reaction rates. The p-values for changes in expression and in reaction rates can be combined to obtain the probabilities for a correlated change between both values (transcriptional regulation), changes in rate not correlated to transcriptional changes (metabolic regulation) and changes in transcription that are not correlated to changes in rate (which we refer to as posttranscriptional regulation).
Figure 4
Figure 4. Main reactions showing transcriptional up (red) or down (green) regulation associated with the glucose-ethanol shift.
The underlined metabolite pools are those that are expected to increase (red) or decrease (green) according to the observed metabolic regulation.
Figure 5
Figure 5. Main reactions showing transcriptional up (red) or down (green) regulation associated with the deletion of HXK2.
The underlined metabolite pools are expected to increase (red) or decrease (green) according to the observed metabolic regulation. The transcription factors controlling the down-regulated pathways are also underlined in green.
Figure 6
Figure 6. This figure illustrates the extent of transcriptional, post-transcriptional and metabolic regulation observed in different metabolic processes for each of the studied cases.
The metabolic processes are defined in the same way as in the iFF708 model. The brightness of the color is proportional to the probability of a reaction in the corresponding process to show transcriptional, post-transcriptional and metabolic regulation respectively. The black correspond to 0 and the white to 1.

References

    1. Patil KR, Nielsen J. Uncovering transcriptional regulation of metabolism by using metabolic network topology. Proc Natl Acad Sci U S A. 2005;102:2685–2689. - PMC - PubMed
    1. Gygi SP, Rochon Y, Franza BR, Aebersold R. Correlation between protein and mRNA abundance in yeast. Mol Cell Biol. 1999;19:1720–1730. - PMC - PubMed
    1. Yang C, Hua Q, Shimizu K. Integration of the information from gene expression and metabolic fluxes for the analysis of the regulatory mechanisms in Synechocystis. Appl Microbiol Biotechnol. 2002;58:813–822. - PubMed
    1. Moxley JF, Jewett MC, Antoniewicz MR, Villas-Boas SG, Alper H, et al. Linking high-resolution metabolic flux phenotypes and transcriptional regulation in yeast modulated by the global regulator Gcn4p. Proc Natl Acad Sci U S A. 2009;106:6477–6482. - PMC - PubMed
    1. Fong SS, Nanchen A, Palsson BO, Sauer U. Latent pathway activation and increased pathway capacity enable Escherichia coli adaptation to loss of key metabolic enzymes. J Biol Chem. 2006;281:8024–8033. - PubMed

Publication types

MeSH terms

LinkOut - more resources