. 2010 Jan 1;1(1):50-61.
doi: 10.1177/1947601909356352.

Erythropoietin Receptor Signaling Through STAT3 Is Required For Glioma Stem Cell Maintenance

Affiliations

Erythropoietin Receptor Signaling Through STAT3 Is Required For Glioma Stem Cell Maintenance

Yiting Cao et al. Genes Cancer. .

Abstract

Recombinant erythropoietin (EPO) is a growth factor used in the treatment of chemotherapy-induced anemia, but recent studies suggest that EPO may accelerate cancer growth. Although several cancers express EPO receptors (EPORs), the mechanism by which EPOR promotes tumor growth remains poorly understood. Glioblastomas display a cellular hierarchy of self-renewal and tumor propagation restricted to glioma stem cells (GSCs). We find that GSCs express higher levels of EPOR than matched non-stem glioma cells. Prospective enrichment for EPOR on GSCs increased neurosphere formation, suggesting that EPOR can select for a subset of GSCs with increased self-renewal capacity. Targeting EPOR expression with lentiviral mediated short hairpin RNA (shRNA) reduced GSC growth, survival, and neurosphere formation capacity, defining a crucial role for EPOR in GSC maintenance. We further find that STAT3 is an important mediator of EPOR signals in GSCs. EPOR knockdown attenuated the basal activation of STAT3 present in GSCs, and a small molecule inhibitor of STAT3 reduced GSC growth and survival. EPOR signaling was critical for survival in vivo, as targeting EPOR expression decreased GSC tumorigenic potential. Elevated EPOR expression also associated with poor patient outcome. Thus, EPOR on GSCs promotes tumor growth and may explain the poor survival of cancer patients treated with EPO.


Conflict of interest statement

The authors declared no potential conflicts of interest with respect to the authorship and/or publication of this article.

Figures
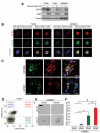
Figure 1.
Figure 1.
Elevated erythropoietin receptor (EPOR) expression in glioma stem cells (GSCs). (A) Western blotting revealed higher expression of EPOR in GSCs in comparison to matched nonstem glioma cells. GSCs were isolated from an established D456MG human glioma xenograft or T3359 and T3691 glioma patient specimens passaged short term in immunocompromised mice. Oligo2 and tubulin were respectively detected as a stem cell marker and the loading control. (B) Immunofluorescent staining demonstrated costaining of EPOR and CD133 in T3359 and D456MG GSCs but not matched nonstem glioma cells. Bar = 10 µm. (C) Immunofluorescent staining of frozen sections of human glioma patient specimens demonstrated costaining of EPOR and CD133 in HP3359 and HP337 samples. Bar = 10 µm. (D) A representative fluorescent-activated cell sorting (FACS) plot that resulted from analysis of bulk cells isolated from a T3359 glioblastoma patient specimen passaged short term in immunocompromised mice. (E) Representative images of neurospheres formed from cells isolated by FACS from each quadrant of CD133 and EPOR stained D456MG cells. Bar = 50 µm. (F) Percentage of wells with neurospheres formed from cells isolated by FACS from each quadrant of CD133- and EPOR-stained D456MG cells. *P < 0.05; #P < 0.01, one-way analysis of variance, n = 3.
Figure 2.
Figure 2.
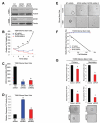
Targeting erythropoietin receptor (EPOR) expression in glioma stem cells (GSCs) reduces cell growth associated with decreased survival and neurosphere formation capacity. (A) Western blotting demonstrated successful knockdown of EPOR expression using lentivirus expressing two different EPOR-targeted short-hairpin RNA (shRNA) constructs (EPOR shRNA1 and EPOR shRNA2) in comparison to a nontargeting shRNA (NT) in T3691 and T3359 GSCs. (B) EPOR knockdown with two distinct shRNAs decreased the growth of T3691 GSCs in comparison to nontargeting control. *P < 0.001, one-way analysis of variance (ANOVA), n = 3. (C) Targeting EPOR significantly inhibited GSC proliferation. [3H]thymidine incorporation was decreased in T3691 GSCs infected with either one of two different EPOR shRNAs in comparison to a nontargeting control shRNA. *P < 0.001, one-way ANOVA, n = 5. (D) Loss of EPOR expression significantly increased apoptosis. Targeting EPOR with two different shRNAs increased relative caspase 3/7 activity (Promega, Madison, WI) in comparison to nontargeting control shRNA in T3691 GSCs. *P < 0.001, one-way ANOVA, n = 3. (E) Representative images demonstrating reduced neurosphere formation in T3359 and T3691 GSCs with two different EPOR targeting shRNA constructs (EPOR shRNA1 and EPOR shRNA2) in comparison to nontargeting (NT) control. (F) Targeting EPOR inhibits neurosphere formation capacity in primary passages. Increasing numbers of T3359 GSCs infected with the indicated shRNAs were plated per well and the percentage of wells demonstrating neurospheres determined after 4 days (n = 12). (G) Targeting EPOR inhibits neurosphere formation in sequential passages. Ten T3359 GSCs were plated in the presence of 1 µg/mL recombinant human soluble EPO receptor or bovine serum albumin as the control. For the primary passage, the percentage of wells with neurospheres and the number of neurospheres per well were quantified after 7 days. For the secondary passage, neurospheres formed in the primary passage were harvested and dissociated and the experiment repeated. Representative images of neurospheres formed in primary and secondary passages are shown. *P < 0.05, Student’s t test, n = 5.
Figure 3.
Figure 3.
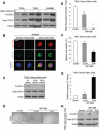
Basal activation of STAT3 in glioma stem cells (GSCs) is decreased by targeting erythropoietin receptor (EPOR), and targeting STAT3 decreases GSC growth. (A) Western blotting demonstrated elevated levels of total STAT3 and phosphorylated STAT3 (Tyr705) in T3359, T3691, or D456MG GSCs compared to matched nonstem glioma cells. (B) Immunofluorescent staining demonstrated that GSCs expressed higher levels of phosphorylated-STAT3 (Try705) than matched nonstem glioblastoma cells isolated from a D456MG glioblastoma xenograft. Bar = 10 µm. (C) Western blotting demonstrated that EPOR knockdown with two different short-hairpin RNAs (shRNAs) inhibited the phosphorylation of STAT3 at Tyr705 in comparison to a nontargeting control shRNA (NT) in T3691 GSCs. (D-G) Treatment with the JAK2/STAT3 signaling inhibitor WP1066 decreases the growth and survival of GSCs. (D) Representative images demonstrated that addition of WP1066 impaired the growth of T3691 GSCs. Bar = 400 µm. (E) WP1066 treatment impaired neurosphere formation in T3691 GSCs. The average number of neurospheres per field is displayed. *P < 0.05, one-way analysis of variance (ANOVA), n = 6. (F) WP1066 treatments significantly reduced T3691 GSC viability as demonstrated by the Cell Titer Glo assay (Promega, Madison, WI). *P < 0.05, one-way ANOVA, n = 6. (G) WP1066 treatment significantly increased apoptosis as demonstrated by the relative caspase 3/7 activity in T3691 GSCs. *P < 0.05, one-way ANOVA, n = 6. (H) Western blotting demonstrated WP1066 treatment decreased the phosphorylation of STAT3 at Tyr705 in T3691 GSCs.
Figure 4.
Figure 4.
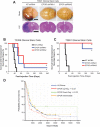
Reduced erythropoietin receptor (EPOR) expression increased survival of mice bearing human glioma xenografts and correlates with increased survival of human glioma patients. (A) Representative images of mouse brains bearing human glioma xenografts originating from T3691 glioma stem cells (GSCs) infected with lentivirus expressing nontargeting (NT) control short-hairpin RNA (shRNA) or EPOR knockdown shRNAs. Images display gross brain and sections stained with hematoxylin and eosin. Bar = 3 mm. (B) Targeting EPOR increases the survival of mice bearing human glioma xenografts originating from T3359 GSCs. Kaplan-Meier analysis demonstrating the survival probability until the development of neurologic signs in nude mice with intracranial inoculation of T3359 human GSCs infected with lentivirus expressing NT control shRNA or two different EPOR knockdown shRNAs. *P < 0.003, log-rank analysis, n = 6. (C) Targeting EPOR increases the survival of mice bearing human glioma xenografts originating from T3691 GSCs, as shown in Kaplan-Meier plots. *P < 0.002, log-rank analysis, n = 6. (D) Kaplan-Meier survival plot for glioma patients with differential tumor EPOR expression calculated by the National Cancer Institute’s Repository for Molecular Brain Neoplasia Data (REMBRANDT) bioinformatics database. The log-rank P value for significance of difference in survival between the EPOR upregulated group and EPOR intermediate group was 0.0112.

References

    1. Central Brain Tumor Registry of the United States (CBTRUS) Statistical report: primary brain tumors in the United States, 1998-2002. Hinsdale, IL: CBTRUS; 2005
    1. Stupp R, Hegi ME, van den Bent MJ, Mason WP, Weller M, Mirimanoff RO, et al. Changing paradigms: an update on the multidisciplinary management of malignant glioma. Oncologist 2006;11:165-80 - PubMed
    1. Hemmati HD, Nakano I, Lazareff JA, Masterman-Smith M, Geschwind DH, Bronner-Fraser M, et al. Cancerous stem cells can arise from pediatric brain tumors. Proc Natl Acad Sci USA 2003;100:15178-83 - PMC - PubMed
    1. Singh SK, Clarke ID, Terasaki M, Bonn VE, Hawkins C, Squire J, et al. Identification of a cancer stem cell in human brain tumors. Cancer Res 2003;63:5821-8 - PubMed
    1. Singh SK, Hawkins C, Clarke ID, Squire JA, Bayani J, Hide T, et al. Identification of human brain tumour initiating cells. Nature 2004;432:396-401 - PubMed