. 2010 Sep;77(6):1595-605.
doi: 10.1111/j.1365-2958.2010.07310.x. Epub 2010 Aug 16.

PhoB regulates both environmental and virulence gene expression in Vibrio cholerae

Affiliations

PhoB regulates both environmental and virulence gene expression in Vibrio cholerae

Jason T Pratt et al. Mol Microbiol. 2010 Sep.

Abstract

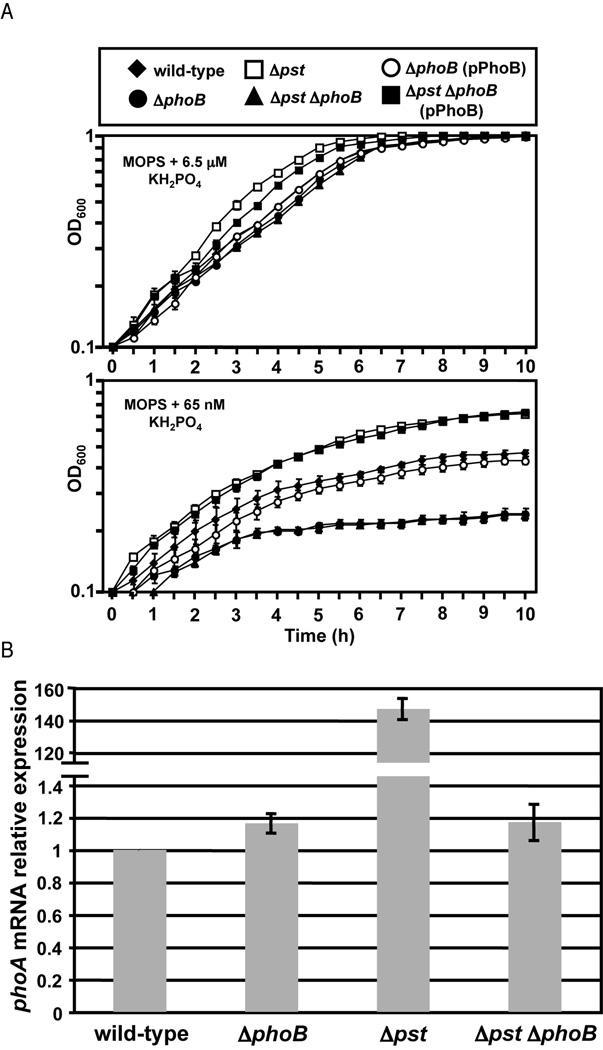
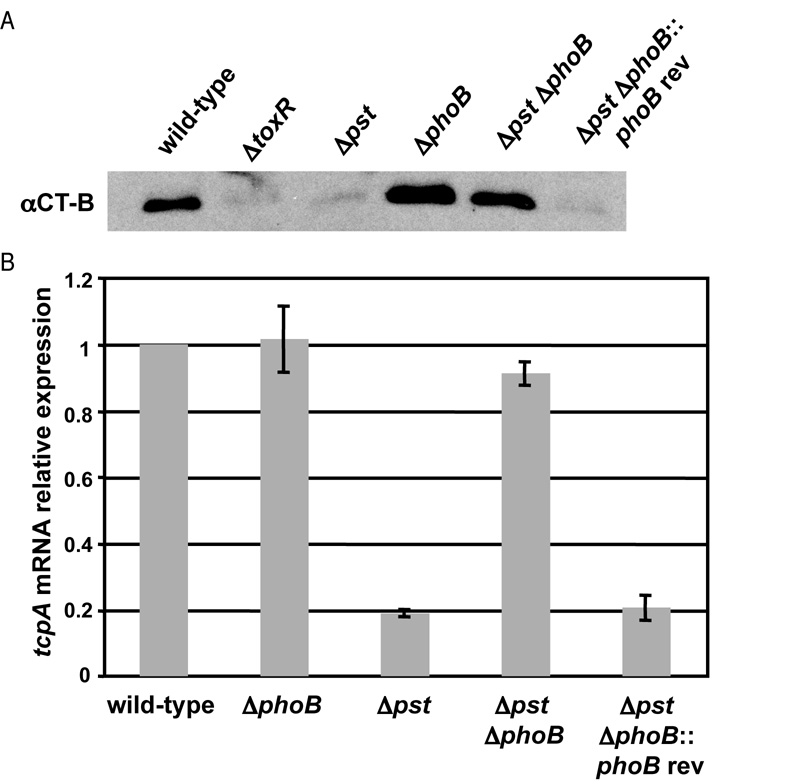
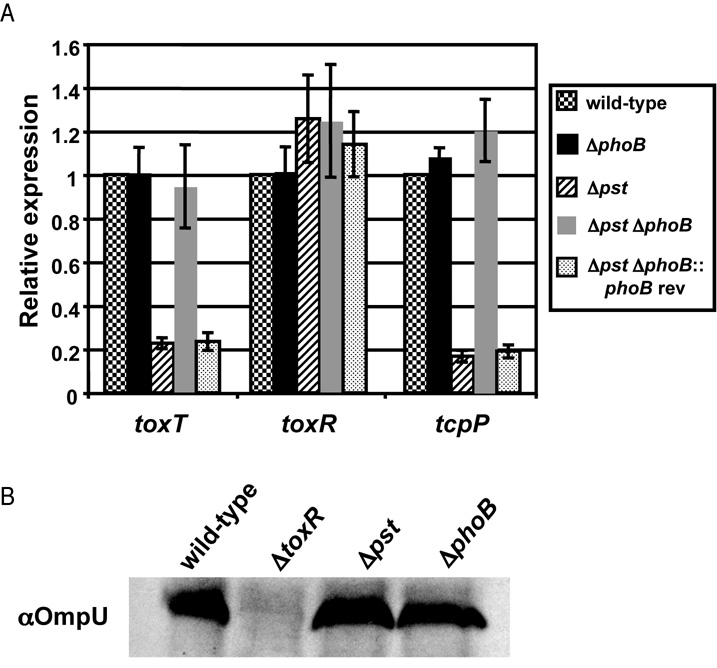
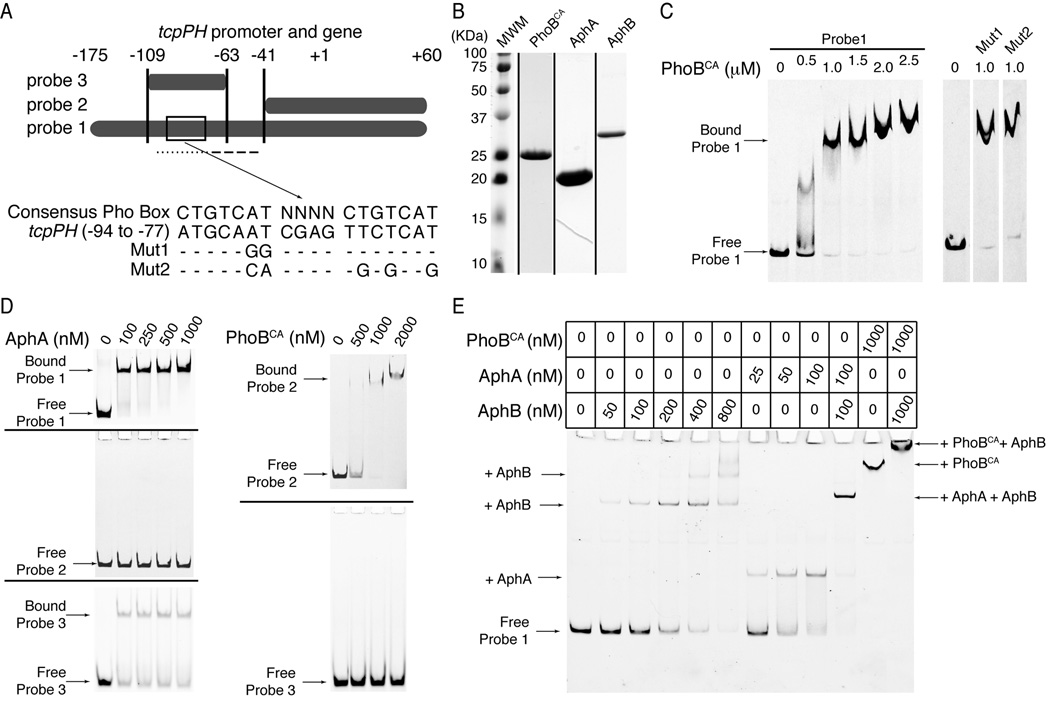
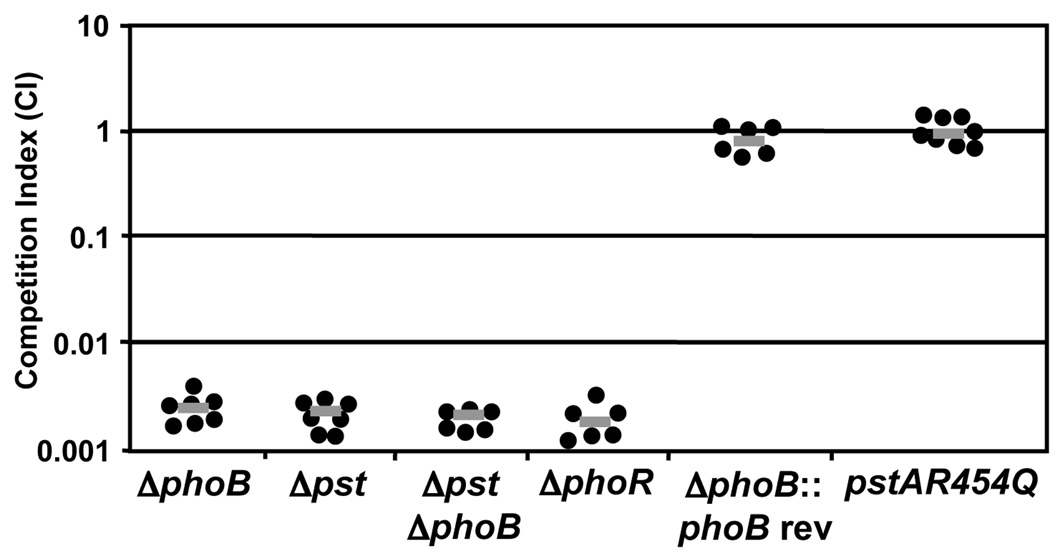
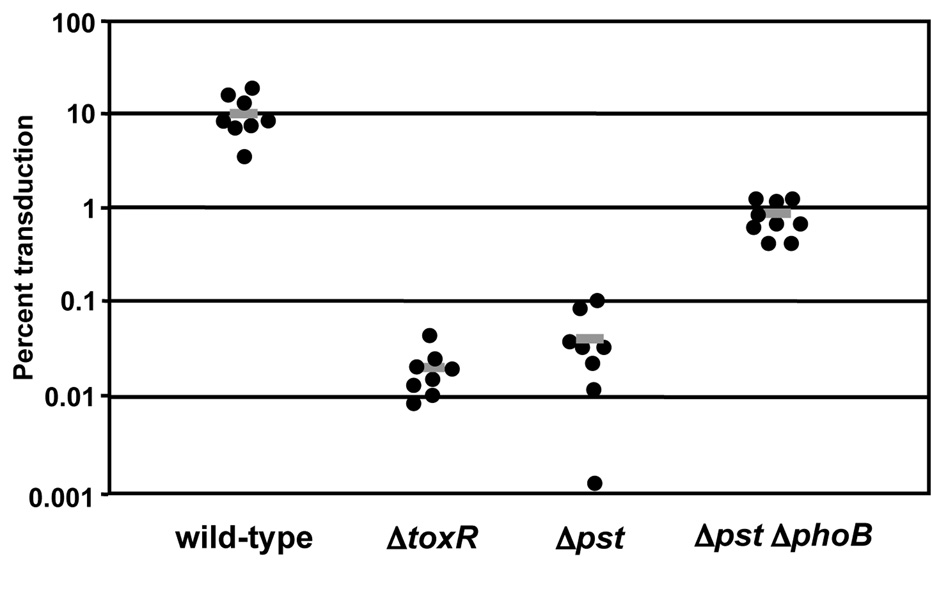
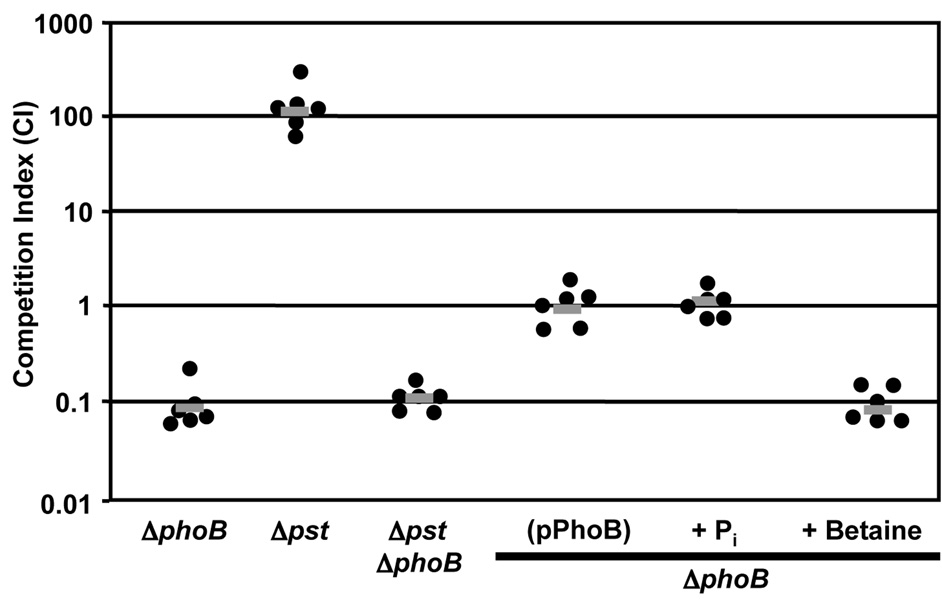
Vibrio cholerae is a facultative pathogen that thrives in two nutritionally disparate environments, aquatic and human small intestine. Phosphate (P(i) ) is an essential nutrient that is limited in aquatic ecosystems and of unknown availability in the small intestine. Here, we show that the P(i) (Pho) regulon, which is controlled by the P(i)-specific transporter (Pst) and two-component system PhoBR, is required for V. cholerae survival in both environments, though for differing reasons. While induction of P(i) acquisition systems including Pst is critical for survival in the aquatic environment, regulation of virulence genes by PhoB and not P(i) transport per se is required for colonization of the small intestine. We show that PhoB regulates virulence genes by directly controlling expression of a key upstream transcriptional regulator, tcpPH. Thus, the Pho regulon includes virulence genes and represents a diverse gene set essential to pathogenic V. cholerae throughout its life cycle.


Figures

Figure 1
Figure 1
Mutation of pst operon leads to activation of PhoB in V. cholerae. V. cholerae strains were grown in MOPS minimal medium supplemented with 6.5 µM or 65 nM KH2PO4 for 10 hours at 37°C. Mean and standard deviation are shown for each time point. All samples were analyzed in triplicate. B) Quantitative RT-PCR (qRT-PCR) analysis of phoA expression. V. cholerae strains were grown in LB at 37°C and RNA collected at OD600=0.3. Expression was normalized to rpoB expression and shown relative to wild-type. The mean and standard deviation for three independent replicates are shown.
Figure 2
Figure 2
PhoB regulates virulence gene expression in V. cholerae. V. cholerae strains were grown in M9 + NRES at 30°C. A) Western blot analysis for CT-B subunit. Secreted proteins were isolated after overnight incubation. Western blot was performed as outlined in Experimental Procedures. B) qRT-PCR analysis of tcpA expression. RNA was collected at OD600=0.3. Expression was normalized to rpoB expression and shown relative to wild-type. The mean and standard deviation for three independent replicates are shown.
Figure 3
Figure 3
PhoB regulates the expression of toxT and tcpP. V. cholerae strains were grown in M9 + NRES at 30°C to OD600=0.3. A) qRT-PCR analysis of toxT, tcpP and toxR expression. Expression was normalized to rpoB expression and shown relative to wild-type. The mean and standard deviation for three biological replicates are shown. B) Western blot analysis for OmpU. Western blot was performed as outlined in Experimental Procedures.
Figure 4
Figure 4
PhoB binds to the tcpPH promoter. A) Illustration of the DNA sequences used as probes for protein binding in the gel mobility shift assays in C-E. The boxed area in probe 1 is region −94 to −77 of the tcpPH promoter. Its sequence is shown below it, aligned to the consensus Pho Box sequence. Mut1 and Mut2 show mutations made within this putative tcpPH promoter Pho Box. The dotted line below probe 1 represents the binding site for AphA, whereas the dashed line represents the binding site for AphB.. B) Coomassie stained SDS-PAGE gels for PhoBCA, AphA and AphB. Each lane is from a different gel, representing the peak fraction of the gel filtration run of each protein. C-E) Gel mobility shift assays for binding of PhoBCA, AphA and AphB to the tcpPH promoter region. Zero denotes that no protein was added to the reaction mix. C) On the left: electro-mobility of 6FAM-labeled probe 1 in the presence of increasing concentrations (0.5 to 2.5 µM) of PhoBCA. On the right: electro-mobility of 6FAM-labeled Mut1 and Mut2 of probe 1 in the presence of 1 µM PhoBCA. The free wild type, Mut1 and Mut2 of probe 1 have the same mobility (not shown). The lanes are non-contiguous on the same gel. D) On the left: electro-mobility of 6FAM-labeled probe 1 (upper gel), probe 2 (middle gel) or probe 3 (lower gel) in the presence of increasing concentrations (100 to 1000 nM) of AphA. On the right: electro-mobility of 6FAM-labeled probe 2 (upper gel) or probe 3 (lower gel) in the presence of increasing concentrations (500 to 2000 nM) of PhoBCA. E) Electro-mobility of 6FAM-labeled probe 1 in the presence of PhoBCA, and/or AphA and/or AphB at the concentrations indicated in the table above the gel. The arrows in C-E) indicate the migration level of the complexes formed by the DNA probes and the proteins they are bound to.
Figure 5
Figure 5
Proper regulation of the Pho regulon is required during V. cholerae infection. Competition assays were performed using the infant mouse model of infection. All strains were competed against wild-type O395. The competitive index is the ratio of mutant to wild-type bacteria recovered from the small intestine corrected for the input ratio. Each data point represents the competitive index from an individual mouse; the gray bar represents the geometric mean. The ΔphoB, Δpst, ΔphoB Δpst and ΔphoR strains are significantly attenuated (P<0.01) by Student’s two-tailed t-test.
Figure 6
Figure 6
PhoB regulates the expression of TCP in vivo. TCP expression was measured by in vivo CTXΦ transduction. An O395 CTXcalc-KnΦ donor strain was co-inoculated intra-gastrically into infant mice with wild-type, toxR∷pGP704, Δpst or Δpst ΔphoB. At 21 hrs post-infection V. cholerae were recovered and the frequency of CTXcalc-KnΦ transduction was determined. Each data point represents the transduction frequency from an individual mouse; the gray bar represents the mean. The Δpst strain is significantly attenuated compared to wild-type and Δpst ΔphoB (P<0.01) by the Mann-Whitney U test.
Figure 7
Figure 7
PhoB is required for survival of V. cholerae in pond water. Competition assays were performed in pond water. All strains were competed against wild-type O395. The competitive index is the ratio of mutant to wild-type bacteria recovered from the pond water following 4 h incubation at 37°C with aeration and corrected for the input ratio. Each data point represents the competitive index from an individual competition; the gray bar represents the geometric mean. Pond water was supplemented with 6.5 µM KH2PO4 (Pi) or 6.5 µM betaine as noted. The ΔphoB and ΔphoB Δpst strains are significantly attenuated (P<0.01) and Δpst is significantly more fit (P<0.01) by Student’s two-tailed t-test.

Similar articles

Cited by

References

    1. Arribas-Bosacoma R, Kim SK, Ferrer-Orta C, Blanco AG, Pereira PJ, Gomis-Rüth FX, Wanner BL, Coll M, Solà M. The X-ray crystal structures of two constitutively active mutants of the Escherichia coli PhoB receiver domain give insights into activation. J Mol Biol. 2007;366:626–641. - PMC - PubMed
    1. Bahrani-Mougeot FK, Buckles EL, Lockatell CV, Hebel JR, Johnson DE, Tang CM, Donnenberg MS. Type 1 fimbriae and extracellular polysaccharides are preeminent uropathogenic Escherichia coli virulence determinants in the murine urinary tract. Mol Microbiol. 2002;45:1079–1093. - PubMed
    1. Bourassa L, Camilli A. Glycogen contributes to the environmental persistence and transmission of Vibrio cholerae. Mol Microbiol. 2009;72:124–138. - PMC - PubMed
    1. Callahan LT, Ryder RC, Richardson SH. Biochemistry of Vibrio cholerae virulence. II. Skin permeability factor-cholera enterotoxin production in a chemically defined medium. Infect Immun. 1971;4:611–618. - PMC - PubMed
    1. Chatterjee SS, Hossain H, Otten S, Kuenne C, Kuchmina K, Machata S, Domann E, Chakraborty T, Hain T. Intracellular gene expression profile of Listeria monocytogenes. Infect Immun. 2006;74:1323–1338. - PMC - PubMed

Publication types