. 2010 Jul 26;11(1):102.
doi: 10.1186/1465-9921-11-102.

NO2 inhalation induces maturation of pulmonary CD11c+ cells that promote antigenspecific CD4+ T cell polarization

Affiliations

NO2 inhalation induces maturation of pulmonary CD11c+ cells that promote antigenspecific CD4+ T cell polarization

Samantha R Hodgkins et al. Respir Res. .

Abstract

Background: Nitrogen dioxide (NO2) is an air pollutant associated with poor respiratory health, asthma exacerbation, and an increased likelihood of inhalational allergies. NO2 is also produced endogenously in the lung during acute inflammatory responses. NO2 can function as an adjuvant, allowing for allergic sensitization to an innocuous inhaled antigen and the generation of an antigen-specific Th2 immune response manifesting in an allergic asthma phenotype. As CD11c+ antigen presenting cells are considered critical for naïve T cell activation, we investigated the role of CD11c+ cells in NO2-promoted allergic sensitization.

Methods: We systemically depleted CD11c+ cells from transgenic mice expressing a simian diphtheria toxin (DT) receptor under of control of the CD11c promoter by administration of DT. Mice were then exposed to 15 ppm NO2 followed by aerosolized ovalbumin to promote allergic sensitization to ovalbumin and were studied after subsequent inhaled ovalbumin challenges for manifestation of allergic airway disease. In addition, pulmonary CD11c+ cells from wildtype mice were studied after exposure to NO2 and ovalbumin for cellular phenotype by flow cytometry and in vitro cytokine production.

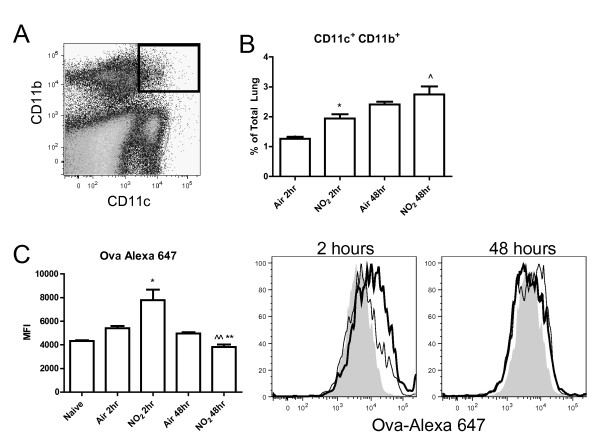
Results: Transient depletion of CD11c+ cells during sensitization attenuated airway eosinophilia during allergen challenge and reduced Th2 and Th17 cytokine production. Lung CD11c+ cells from wildtype mice exhibited a significant increase in MHCII, CD40, and OX40L expression 2 hours following NO2 exposure. By 48 hours, CD11c+MHCII+ DCs within the mediastinal lymph node (MLN) expressed maturation markers, including CD80, CD86, and OX40L. CD11c+CD11b- and CD11c+CD11b+ pulmonary cells exposed to NO2 in vivo increased uptake of antigen 2 hours post exposure, with increased ova-Alexa 647+ CD11c+MHCII+ DCs present in MLN from NO2-exposed mice by 48 hours. Co-cultures of ova-specific CD4+ T cells from naïve mice and CD11c+ pulmonary cells from NO2-exposed mice produced IL-1, IL-12p70, and IL-6 in vitro and augmented antigen-induced IL-5 production.

Conclusions: CD11c+ cells are critical for NO2-promoted allergic sensitization. NO2 exposure causes pulmonary CD11c+ cells to acquire a phenotype capable of increased antigen uptake, migration to the draining lymph node, expression of MHCII and co-stimulatory molecules required to activate naïve T cells, and secretion of polarizing cytokines to shape a Th2/Th17 response.


Figures

Figure 1
Figure 1
Diphtheria toxin-mediated depletion of CD11c+ cells in the lung. Eight- to fifteen-week-old female CD11c-DTR Tg+ and Tg- mice were administered 4ng DT/g of body weight via i.p. injection. Twenty-four hours later, lungs were harvested, digested into single-cell suspensions, and immunostained. Total lung cells were visualized by flow cytometry (A) and CD11c+ cells from the parent gate were identified (B). Graphs show percent CD11c+ cells from the lung (C) and total number of CD11c+ cells in the lung, calculated based on the % CD11c+ cells multiplied by the number of cells in the single-cell suspension from the lungs (D). Values are mean ± SEM with 4 animals per group. ** denotes p < 0.01 by Student's t test.
Figure 2
Figure 2
Effects of depleting CD11c+ cells during sensitization in an NO2-promoted allergic asthma model. Eight- to fifteen-week-old female CD11c-DTR Tg+ and Tg- mice were administered 4 ng DT/g of body weight via i.p. injection on day -1. All mice then underwent inhalation of 15 ppm NO2 for 1 hour followed by 30 minutes of aerosolized ova on day 0. All mice were challenged with aerosolized ova on days 14, 15, and 16. Differential cell counts were measured from the BAL fluid 48 hours after the final ova challenge (A). Values shown are mean ± SEM with 8 Tg- and 5 Tg+ mice per group. CD4+ cells were isolated from spleens by positive selection on day 18 and co-cultured with antigen presenting cells (APCs) from naïve C57BL/6J mice and 100 μg/ml ova. Conditioned medium was collected at 96 hours and analyzed for the Th2 cytokines IL-4 (B), IL-5 (C), and IL-13 (D), and the Th17 cytokine IL-17 (E) by ELISA. No cytokines were detected in medium from APCs cultured alone or from CD4+ T cells cultured with APCs in the absence of ova. Values shown are mean ± SEM with 4-5 mice per group. The ova-specific immunoglobulins IgE (F) and IgG1 (G) were measured from serum collected 48 hours after the final ova challenge (day 18) by ELISA using serum from Alum/ova-immunized mice to generate standard curves. Values shown are mean ± SEM with 7-10 mice per group. Statistics were computed by unpaired Student's t test. * denotes p < 0.05 and ** denotes p < 0.01 compared with respective Tg- samples.
Figure 3
Figure 3
Number and maturation status of lung CD11c+CD11b- cells following NO2 and ova exposure. Mice were exposed to 1 hour of 15ppm NO2 or air followed by 30 minutes of aerosolized 3.4% ova. Lungs were harvested 2 and 48 hours later, single cell suspensions were generated and stained with antibodies, and cells were analyzed by flow cytometry. Dead cells were excluded by FSC and SSC gating and then total lung cells were gated comparing CD11c and CD11b expression, with future analyses focusing on the CD11c+CD11b- population (bold gate, A). The total number of CD11c+CD11b- cells within the lung was enumerated (B) and the maturation status of these cells was assessed by median fluorescence intensity (MFI) of MHCII and the co-stimulatory molecules CD40 and OX40L 2 hours post exposure (C). NO2-exposed animals are represented by a thick line or black bar while air-exposed animals are represented by a thin line or white bar. Grey, filled histograms are isotype controls. Data shown are mean ± SEM with 3 animals per group and are representative of experiments performed twice. * denotes p < 0.05 and ** denotes p < 0.01 versus air control at the same time point by unpaired Student's t test. ^ denotes p < 0.05 and ^^ denotes p < 0.01 versus 2 hours post NO2 exposure by unpaired Student's t test.
Figure 4
Figure 4
Number and maturation status of lung CD11c+CD11b+ cells following NO2 and ova exposure. Mice were exposed to 1 hour of 15 ppm NO2 or Air followed by 30 minutes of aerosolized 3.4% ova. Lungs were harvested 2 and 48 hours later, single cell suspensions were generated and stained with antibodies, and cells were analyzed by flow cytometry. Dead cells were excluded by FSC and SSC gating and then total lung cells were gated comparing CD11c and CD11b expression, with future analyses focusing on the CD11c+CD11b+ population (bold gate, A). The total number of CD11c+CD11b+ cells within the lung was enumerated (B) and the maturation status of these cells was assessed by expression of MHCII and the co-stimulatory molecules CD40 and CD86 48 hours post exposure (C). Maturation markers are graphed as median fluorescence intensity (MFI). NO2-exposed animals are represented by a thick line or black bar while air-exposed animals are represented by a thin line or white bar. Grey, filled histograms are isotype controls. Data shown are mean ± SEM with 3 animals per group and are representative of experiments performed twice. Differences did not reach statistical significance by unpaired Student's t test.
Figure 5
Figure 5
CD11c+ dendritic cell maturation status in mediastinal lymph nodes (MLN) following NO2 and ova exposure. Mice were exposed to 1 hour of 15 ppm NO2 or air followed by 30 minutes of aerosolized 3.4% ova. Lungs were harvested 2 and 48 hours later, single cell suspensions were generated and stained with antibodies, and cells were analyzed by flow cytometry. Only CD45+ MLN cells were included in analyses. NO2-exposed animals are represented by a thick line while air-exposed animals are represented by a thin line. Grey, filled histograms are isotype controls. CD11c+MHCII+ cells were measured as a percent of all CD45+ MLN cells (A) and were analyzed for expression of the markers CD80, CD86, CD40, OX40L, and CD11b at 2 hours (B) and 48 hours (C) post exposure. Marker expression is shown as median fluorescence intensity (MFI). Data shown represent MLN cells pooled from 3 animals per group and are representative of experiments performed twice.
Figure 6
Figure 6
Effects of NO2 inhalation on antigen capture in CD11c+CD11b+ lung cells in vivo. Mice were exposed to air or 15 ppm NO2 for one hour followed by oropharyngeal aspiration of 50 μg of ova-Alexa 647. Lungs were harvested 2 and 48 hours later, single cell suspensions were generated and stained with antibodies, and cells were analyzed by flow cytometry. Dead cells were excluded by FSC and SSC gating and then total lung cells were gated comparing CD11c and CD11b expression, with future analyses focusing on the CD11c+CD11b+ population (bold gate, A). The percent of CD11c+CD11b+ cells within the lung was determined (B) and uptake of the antigen ova-Alexa 647 was quantified by median fluorescence intensity (MFI) (C). NO2-exposed animals are represented by a thick line while air-exposed animals are represented by a thin line. Grey, filled histograms are naive controls (did not receive ova-Alexa 647) (C). Data shown are mean ± SEM with 4 animals per group and are representative of experiments performed twice. * denotes p < 0.05 and ** denotes p < 0.01 versus air control at the same time point by unpaired Student's t test. ^ denotes p < 0.05 and ^^ denotes p < 0.01 versus 2 hours post NO2 exposure by unpaired Student's t test.
Figure 7
Figure 7
Pro-inflammatory cytokine production and induction of CD4+ T cell cytokine production ex vivo by NO2-exposed pulmonary CD11c+ cells. Mice were exposed to air or 15 ppm NO2 for 1 hour followed by 30 minutes of aerosolized 3.4% ova. Forty-eight hours later, CD11c+ cells were purified from lungs via positive selection and used as antigen presenting cells co-cultured with CD4+ T cells purified from the spleen of OTII transgenic mice via positive selection. CD11c+ cells (2 × 10⁶ cells/ml) co-cultured with T cells (1 × 10⁶ cells/ml) were stimulated with 100 μg/ml ova323-339 and cultured for 4 days or left unstimulated in media alone. Conditioned medium were analyzed via BioPlex for pro-inflammatory mediators associated with CD11c+ cell activation (IL-1α and IL-1β) (A) and T cell polarization (IL-12p70 and IL-6) (B). Cytokines associated with T cell proliferation (IL-2) (C) as well as cytokines produced by activated Th2 cells (IL-5 and IL-13) (C, D) and Th17 cells (IL-17) (D) were measured. Data shown are mean ± SEM with 6 mice per group. * denotes p < 0.05, ** denotes p < 0.01, *** denotes p < 0.001 compared with Air Stim as determined by one-way ANOVA with Bonferroni post test.
Figure 8
Figure 8
Effects of NO2 inhalation on antigen capture in CD11c+CD11b- lung cells in vivo. Mice were exposed to air or 15 ppm NO2 for one hour followed by oropharyngeal aspiration of 50 μg of ova-Alexa 647. Lungs were harvested 2 and 48 hours later, single cell suspensions were generated and stained with antibodies, and cells were analyzed by flow cytometry. Dead cells were excluded by FSC and SSC gating and then total lung cells were gated comparing CD11c and CD11b expression, with future analyses focusing on the CD11c+CD11b- population (bold gate, A). The percent of CD11c+CD11b- cells within the lung was determined (B) and uptake of the antigen ova-Alexa 647 was quantified by median fluorescence intensity (MFI) (C). NO2-exposed animals are represented by a thick line while air-exposed animals are represented by a thin line. Grey, filled histograms are naive controls (did not receive ova-Alexa 647) (C). Data shown are mean ± SEM with 4 animals per group and are representative of experiments performed twice. * denotes p < 0.05 and ** denotes p < 0.01 versus air control at the same time point by unpaired Student's t test. ^^ denotes p < 0.01 and ^^^ denotes p < 0.001 versus 2 hours post NO2 exposure by unpaired Student's t test.
Figure 9
Figure 9
Effects of NO2 inhalation on antigen-containing dendritic cells in the mediastinal lymph node. Mice were exposed to air or 15 ppm NO2 for 1 hour followed by oropharyngeal aspiration of 50 μg of ova-Alexa 647. MLN were harvested 2 and 48 hours later, single cell suspensions were generated and stained with antibodies, and cells were analyzed by flow cytometry. CD11c+MHCII+ cells (DCs) were gated as a percentage of CD45+ cells in the MLN (A). DC retention of the antigen ova-Alexa 647 was quantified by the median fluorescence intensity (MFI) of Alexa 647 (B). The histogram represents ova-Alexa 647 retention at 48 hours post exposure (C). NO2-exposed animals are represented by a thick line while air-exposed animals are represented by a thin line. Grey, filled histograms are naive controls (did not receive ova-Alexa 647) (C). The maturation status of the DC population was assessed by expression of MHCII (D). Data shown are mean ± SEM with 4 animals per group and are representative of experiments performed twice. * denotes p < 0.05 versus air control at the same time point by unpaired Student's t test. ^ denotes p < 0.05 versus 2 hours post NO2 exposure by unpaired Student's t test.

Similar articles

Cited by

References

    1. Mannino DM, Homa DM, Pertowski CA, Ashizawa A, Nixon LL, Johnson CA, Ball LB, Jack E, Kang DS. Surveillance for asthma--United States, 1960-1995. MMWR CDC Surveill Summ. 1998;47(1):1–27. - PubMed
    1. Herrick CA, Bottomly K. To respond or not to respond: T cells in allergic asthma. Nat Rev Immunol. 2003;3(5):405–412. doi: 10.1038/nri1084. - DOI - PubMed
    1. Al-Ramli W, Prefontaine D, Chouiali F, Martin JG, Olivenstein R, Lemiere C, Hamid Q. T(H)17-associated cytokines (IL-17A and IL-17F) in severe asthma. J Allergy Clin Immunol. 2009;123(5):1185–1187. doi: 10.1016/j.jaci.2009.02.024. - DOI - PubMed
    1. McKinley L, Alcorn JF, Peterson A, Dupont RB, Kapadia S, Logar A, Henry A, Irvin CG, Piganelli JD, Ray A. et al.TH17 cells mediate steroid-resistant airway inflammation and airway hyperresponsiveness in mice. J Immunol. 2008;181(6):4089–4097. - PMC - PubMed
    1. Alcorn JF, Crowe CR, Kolls JK. TH17 cells in asthma and COPD. Annu Rev Physiol. 2010;72:495–516. doi: 10.1146/annurev-physiol-021909-135926. - DOI - PubMed

Publication types

MeSH terms