. 2010 Oct 15;346(2):204-14.
doi: 10.1016/j.ydbio.2010.07.022. Epub 2010 Jul 24.

The C. elegans adult male germline: stem cells and sexual dimorphism

Affiliations

The C. elegans adult male germline: stem cells and sexual dimorphism

Dyan E Morgan et al. Dev Biol. .

Abstract

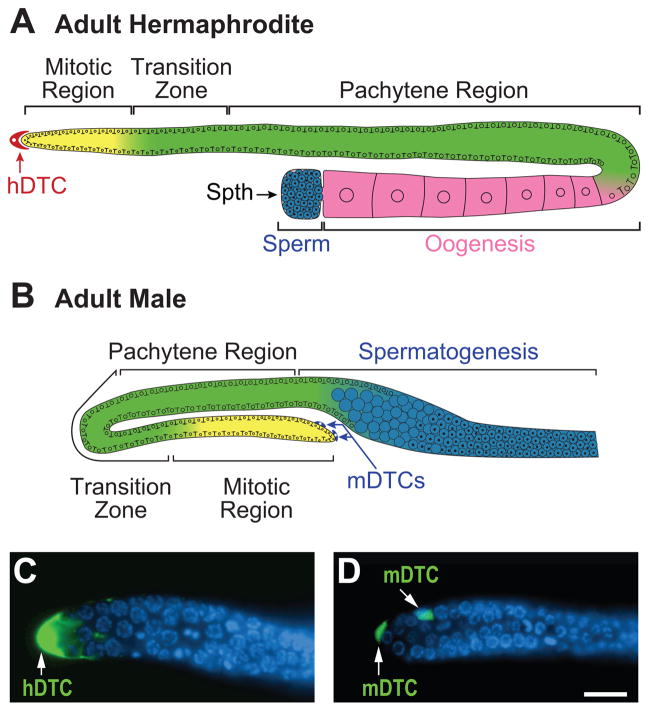
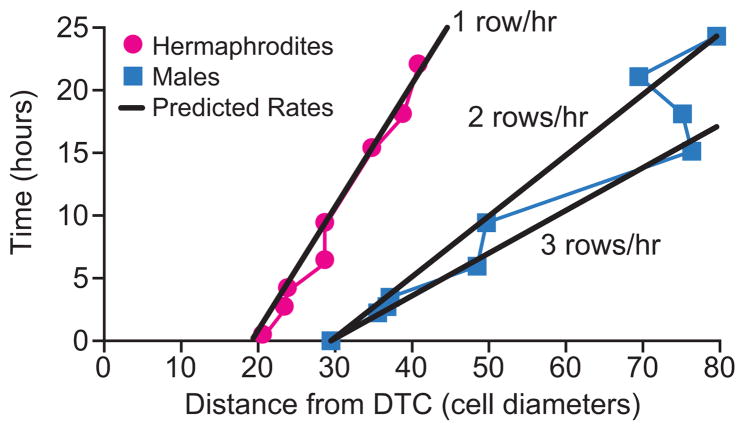
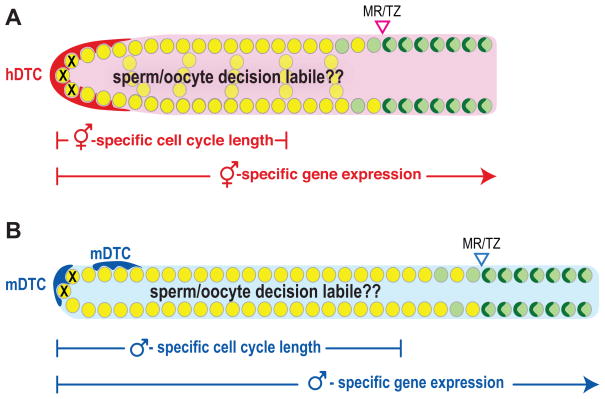
The hermaphrodite Caenorhabditis elegans germline has become a classic model for stem cell regulation, but the male C. elegans germline has been largely neglected. This work provides a cellular analysis of the adult C. elegans male germline, focusing on its predicted stem cell region in the distal gonad. The goals of this study were two-fold: to establish the C. elegans male germline as a stem cell model and to identify sex-specific traits of potential relevance to the sperm/oocyte decision. Our results support two major conclusions. First, adult males do indeed possess a population of germline stem cells (GSCs) with properties similar to those of hermaphrodite GSCs (lack of cell cycle quiescence and lack of reproducibly oriented divisions). Second, germ cells in the mitotic region, including those most distal within the niche, exhibit sex-specific behaviors (e.g. cell cycle length) and therefore have acquired sexual identity. Previous studies demonstrated that some germ cells are not committed to a sperm or oocyte cell fate, even in adults. We propose that germ cells can acquire sexual identity without being committed to a sperm or oocyte cell fate.


Figures

Fig. 1
Fig. 1
Adult hermaphrodite and male DTCs and germline organization. (A, B) A single somatic hermaphrodite distal tip cell (hDTC) (red) and two somatic male distal tip cells (mDTCs) (blue) reside at the distal ends of the adult hermaphrodite and male gonads, respectively. Each hermaphrodite has two gonadal arms, whereas each male has one. Mitotically dividing germ cells (yellow) are restricted to the mitotic region; germ cells move proximally from the mitotic region to enter the meiotic cell cycle and progress through early meiotic prophase (green) in the transition zone and pachytene region; they mature as oocytes (pink) in adult hermaphrodites or sperm (blue) in adult males. Larval hermaphrodites make sperm that are stored in the adult spermatheca (Spth). Other cells in the somatic gonad differ by sex, including the sheath cells that embrace meiotic germ cells in the hermaphrodite, but not male, gonad (Kimble and Hirsh, 1979). (C, D) Fluorescence micrographs of adult distal gonads dissected from a hermaphrodite (C) and male (D) show DAPI-stained germ cell nuclei (blue) and GFP-expressing somatic DTCs (green, arrows). Scale bar represents 15 microns.
Fig. 2
Fig. 2
Evidence for male GSCs and their cellular properties. (A–C) Projections of confocal z-series of male gonads. Dashed line, MR/TZ boundary. Scale bar in (A) represents 15 microns in A and B; scale bar in (C) represents 15 microns in C. (A–B) Germ cells move proximally from the male mitotic region and contribute to differentiating progeny. Dissected gonads from adult males were labeled with EdU for 30 minutes. EdU gives similar results to BrdU (SLC and JK, unpublished data). EdU (red) and DAPI (blue). (A) EdU label is detected only in the mitotic region. (B) After a 12-hour chase, labeled germ cells have moved from the mitotic region and entered the meiotic cell cycle. Inset in (B) is a projection of the distal gonad using a subset of images that correspond to the distal end, but not the overlapping proximal gonad. (C) No quiescent germ cells reside in the male mitotic region. Dissected gonad from adult male, labeled for 24 hours with BrdU. All germ cell nuclei in the mitotic region co-stain with DAPI (blue) and anti-BrdU (red). (D–F) The positions and orientations of metaphase plates were scored relative to the distal-to-proximal axis of the gonad. Data combines values from wild-type males and Plag-2::GFP him-5 males. (D) Percentage of mitotic divisions at a given position in a given orientation to the distal-to-proximal axis. No trend in orientation was detected. (E, F) Confocal images of distal gonads dissected from wild-type males and stained with DAPI (blue) to visualize both mDTCs and germ cell nuclei. The scale bar in (E) represents 15 microns. (E) Metaphase plate (blue arrowhead) oriented so that one daughter cell will likely lie adjacent to the mDTC (white arrow) and the other away from the mDTC. (F) Metaphase plate (blue arrowhead) oriented so that both daughter cells are likely to be adjacent to the DTC (white arrow). The inset cartoons depict mDTC (yellow circle) and the predicted positions of daughter cells (smaller white circles) with the orientation of the observed metaphase plate (line).
Fig. 3
Fig. 3
mDTC number controls length of the adult male mitotic region. (A, B) Fluorescence micrographs of the distal gonad from an unablated male (A) or an animal with one mDTC ablated (B). All nuclei are labeled with DAPI (red); mDTCs are marked with GFP (green) under the control of the lag-2 promoter. Expression of this marker is typically very low in mDTCs compared to hDTCs (Chesney et al., 2009). The green dot at the MR/TZ boundary in A is debris on the slide. Scale bar represents 15 microns. Arrows mark mDTCs, dashed white lines mark the MR/TZ boundary. (C) Mitotic region (MR) lengths (with 95% confidence intervals) were shorter than controls after ablation of either the distal or proximal mDTC; the MR was abolished after ablation of both mDTCs. Neither the anaesthetic (levamisole) nor the slide mounting procedure (M9 buffer) affected mitotic region length when mDTCs were left intact.
Fig. 4
Fig. 4
Sexual dimorphism in the distal gonad. (A, B) DAPI-stained distal gonads dissected from adults 24 hours after L4. Hermaphrodite distal gonads (A) are wider than male distal gonads (B). In both sexes, germ cell nuclei reside at the periphery of the gonad; in hermaphrodites, germ cells also form chains (arrowheads) that cross the cytoplasmic core, or “rachis”, that extends along the gonadal axis. The chains of nuclei do not completely block the rachis; focusing through the specimen reveals that the rachis extends around the chains and is continuous to the distal end of the gonad. Dashed white lines mark the MR/TZ boundary. Arrowheads indicate the distal end of the germline. The scale bar represents 15 microns. (C) The mitotic region (MR) and transition zone (TZ) are longer in males than in hermaphrodites, but the number of germ cell nuclei in the MR and TZ is independent of sex. (D) The number of germ cell nuclei in each row from distal to proximal in male (XO, graphed in blue) and hermaphrodite (XX, graphed in pink) germlines. Hermaphrodite germlines are wider and contain more nuclei per row than male germlines. Error bars represent 95% confidence intervals. Data are from 4 hermaphrodite and 3 male germlines. (E) Somatic gonad sex correlates with sexually dimorphic distal gonad morphology. Table comparing MR length (with 95% confidence interval), width of the gonad (correlates with number of cells per row, see below), and presence of chains in DAPI-stained adult gonads. Wild-type data set is the same as in Fig. 2. “Thin” indicates fewer than 10 germ cells per row. “Wide” indicates more than 10 germ cells per row. Male (blue) or female (pink) characteristics and/or tissues are indicated.
Fig. 5
Fig. 5
Data used to estimate cell cycle lengths in male and hermaphrodite germlines. (A, B) S-phase indices. (A) After a 15-minute pulse of EdU, gonads were stained with DAPI (blue) and an Alexa Fluor azide to detect EdU (red). Many cells in the mitotic region were co-labeled, including cells in row 1. EdU labels a similar percentage of cells as BrdU (Crittenden et al., 2006). White arrowhead indicates the distal end of the germline. White dashed line indicates the MR/TZ boundary. The scale bar represents 15 microns. (B) A comparison of male and hermaphrodite S-phase indices by position along the gonadal axis. Both mitotic regions have an average S-phase index (SI) of ~50% (dashed lines). Male SI (blue), hermaphrodite SI (pink). Data from 9 male and 5 hermaphrodite germlines. Inverted triangles indicate the average position of the mitotic region/transition zone (MR/TZ) boundary for hermaphrodites (pink) and males (blue). (C–E) G2-M-G1 interval analysis. (C) Time course of BrdU incorporation. Adult males and hermaphrodites were exposed to BrdU for increasing intervals (X-axis). Gonads were dissected and stained with DAPI and antibodies to BrdU. The percent BrdU-labeled cells was calculated and graphed on the Y-axis for individual male (blue diamonds) and hermaphrodite (pink dots) gonadal arms. Males incorporated BrdU into 100% of mitotic region nuclei in all gonads after 5 hours (circled in blue); hermaphrodites incorporated BrdU into 100% of mitotic region nuclei in all gonads after 10 hours (circled in pink). Some data points are offset on the x-axis to show that multiple samples have reached 100% label. Sample sizes for C are listed with n for males, then hermaphrodites: 15 minutes: 9, 5; 2 hours: 12, 5; 4 hours: 8, 7; 5 hours: 5, 4; 6 hours: 10, 4; 7 hours: 7, 6; 8 hours: 4, 5; 10 hours: 0, 7; 12 hours: 3, 2. (D–E) The same data set as (C) is plotted as percent incorporation by position along the gonad axis; the color code used to depict specific positions is shown at right of graph. Proximal positions in the mitotic region are not graphed because some cells at those positions have likely entered meiosis. For all positions, 100% of cells label by 5 hours in males (D), and 10 hours in hermaphrodites (E).
Fig. 6
Fig. 6
Proximal rates of movement are sexually dimorphic. Adult males and hermaphrodites (24 hours after L4) were pulsed with BrdU for 30 minutes and then chased for the indicated times. Dissected gonads were stained with DAPI and anti-BrdU at each time point. The position of the most proximal border of cells is graphed for males (blue) and hermaphrodites (pink). Germ cells in males move approximately 2–3 rows per hour while germ cells in hermaphrodites move approximately 1 row per hour. Predicted rates of movement (1 row/hr, 2 rows/hr, 3 rows/hr) are graphed in black.
Fig. 7
Fig. 7
Mitotic index of adult C. elegans germlines. (A, B) Graphs of mitotic index (MI) with respect to position along the distal-proximal axis. The average MI is shown as a horizontal dashed line; the dashed line ends at the last row of the average mitotic region for each sex. The average position of the MR/TZ boundary is indicated by an inverted triangle for males (blue) and hermaphrodites (pink). The same data set for wild-type male germlines is used in A and B. Data come from 78 male germlines and 166 hermaphrodite germlines. Error bars represent 95% confidence intervals. (A) Average MIs for the adult male germline at rows 1–2 and rows 3–10 are indicated with grey and green shading respectively. (B) A comparison of male and hermaphrodite mitotic index by position. Males have a higher average mitotic index (compare blue dashed line to pink dashed line) than hermaphrodites. Adult hermaphrodites (XX) exhibit one main peak of mitotic activity (Crittenden et al., 2006; Maciejowski et al., 2006; this work), but adult male germlines (XO) have two peaks. (C) Comparison of average MIs in fog-1 and wild-type mitotic regions. Values are the average plus or minus a 95% confidence interval. Wild-type data are the same as described in A and B. Oocytes do not accumulate in wild-type and mated fog-1 animals. Oocytes do accumulate in unmated XX and XO fog-1 animals.
Fig. 8
Fig. 8
Germ cells in the adult mitotic region have acquired sexual identity. (A, B) Cartoons summarizing sex-specific characteristics of hermaphrodite (A) and male (B) distal gonads. Conventions: germ cells in mitotic cell cycle (yellow); predicted “actual” GSCs (x); germ cells in meiotic cell cycle (green); probable meiotic S-phase nuclei lack crescent; early meiotic prophase I nuclei possess crescent. The MR/TZ boundary (inverted triangle) occurs where multiple nuclei have entered meiotic prophase I. Diagrams depict some sex-specific features (overall dimensions, DTCs, germ cell chains); extents of other sex-specific features are shown below each diagram (see text for explanation). Sexual identity is depicted by background color (pink in hermaphrodite, blue in male). Although all germ cells have sexually identity, some must be sexually labile with respect to commitment to the sperm or oocyte fate (see text for explanation).

References

    1. Aherne WA, Camplejohn RS, Wright NA. An Introduction to Cell Population Kinetics. Edward Arnold Ltd; London: 1977.
    1. Anderson EL, Baltus AE, Roepers-Gajadien HL, Hassold TJ, de Rooij DG, van Pelt AMM, Page DC. Stra8 and its inducer, retinoic acid, regulate meiotic initiation in both spermatogenesis and oogenesis in mice. Proc Natl Acad Sci USA. 2008;105:14976–14980. - PMC - PubMed
    1. Angelo G, Van Gilst M. Starvation protects germline stem cells and extends reproductive longevity in C. elegans. Science. 2009;326:954–958. - PubMed
    1. Austin J, Kimble J. glp-1 is required in the germ line for regulation of the decision between mitosis and meiosis in C. elegans. Cell. 1987;51:589–599. - PubMed
    1. Baltus AE, Menke DB, Hu YC, Goodheart ML, Carpenter AE, de Rooij DG, Page DC. In germ cells of mouse embryonic ovaries, the decision to enter meiosis precedes premeiotic DNA replication. Nat Genet. 2006;38:1430–4. - PubMed

Publication types