. 2010 Oct 8;285(41):31731-41.
doi: 10.1074/jbc.M110.157206. Epub 2010 Jul 20.

Novel Zn2+-binding sites in human transthyretin: implications for amyloidogenesis and retinol-binding protein recognition

Affiliations

Novel Zn2+-binding sites in human transthyretin: implications for amyloidogenesis and retinol-binding protein recognition

Leonardo de C Palmieri et al. J Biol Chem. .

Abstract

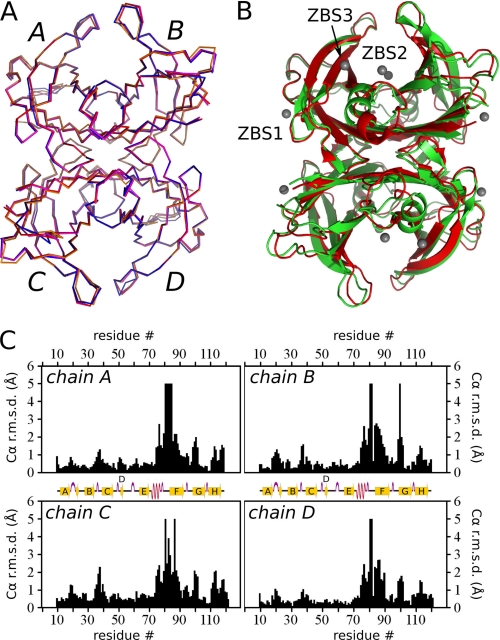
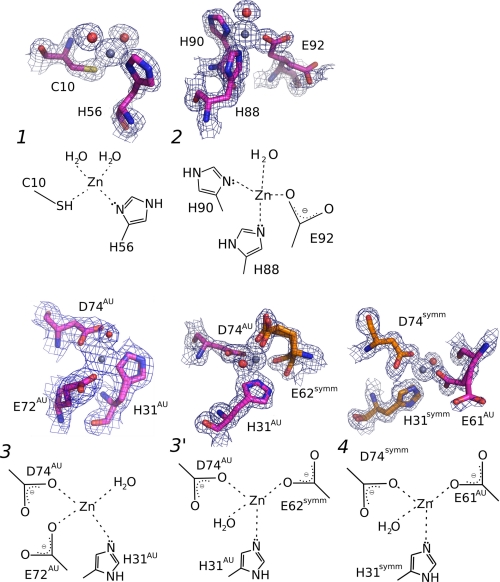
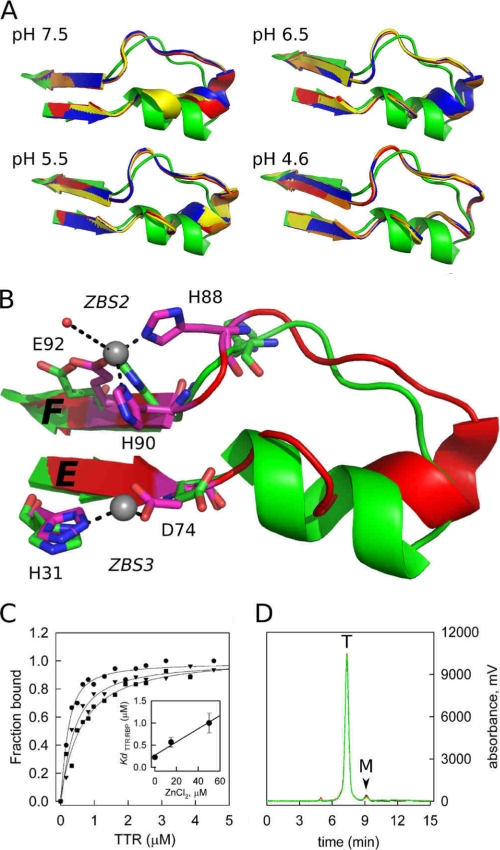
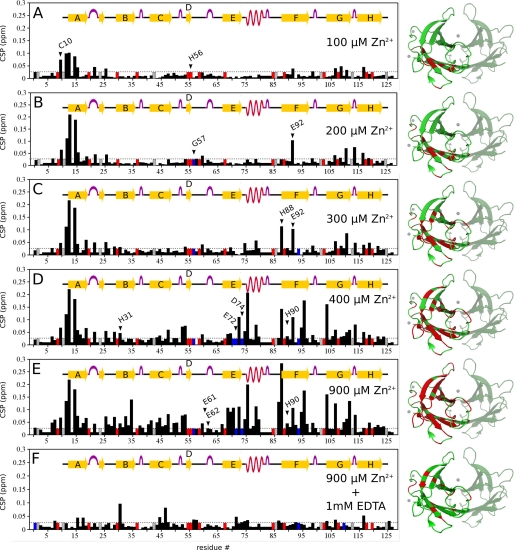
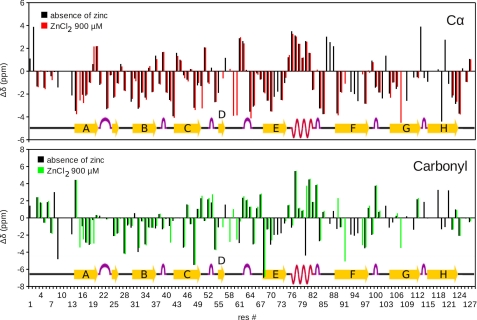
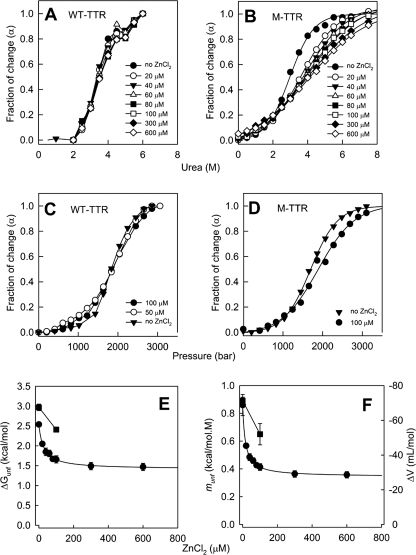
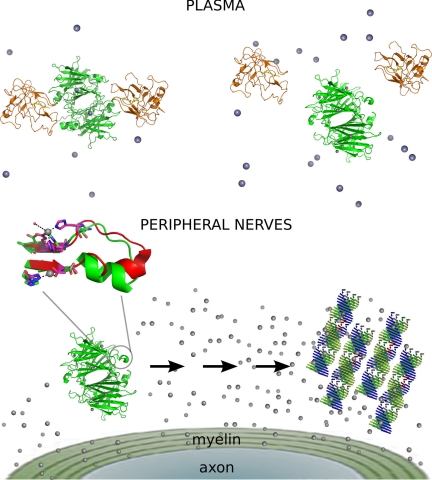
Human transthyretin (TTR) is a homotetrameric protein involved in several amyloidoses. Zn(2+) enhances TTR aggregation in vitro, and is a component of ex vivo TTR amyloid fibrils. We report the first crystal structure of human TTR in complex with Zn(2+) at pH 4.6-7.5. All four structures reveal three tetra-coordinated Zn(2+)-binding sites (ZBS 1-3) per monomer, plus a fourth site (ZBS 4) involving amino acid residues from a symmetry-related tetramer that is not visible in solution by NMR. Zn(2+) binding perturbs loop E-α-helix-loop F, the region involved in holo-retinol-binding protein (holo-RBP) recognition, mainly at acidic pH; TTR affinity for holo-RBP decreases ∼5-fold in the presence of Zn(2+). Interestingly, this same region is disrupted in the crystal structure of the amyloidogenic intermediate of TTR formed at acidic pH in the absence of Zn(2+). HNCO and HNCA experiments performed in solution at pH 7.5 revealed that upon Zn(2+) binding, although the α-helix persists, there are perturbations in the resonances of the residues that flank this region, suggesting an increase in structural flexibility. While stability of the monomer of TTR decreases in the presence of Zn(2+), which is consistent with the tertiary structural perturbation provoked by Zn(2+) binding, tetramer stability is only marginally affected by Zn(2+). These data highlight structural and functional roles of Zn(2+) in TTR-related amyloidoses, as well as in holo-RBP recognition and vitamin A homeostasis.


Figures

FIGURE 1.
FIGURE 1.
Crystallographic structure of TTR complexed with Zn2+. A, Cα alignment of Zn2+:M-TTR structures at pH 7.5 (red), 6.5 (magenta), 5.5 (blue), and 4.6 (orange) (PDB IDs 3GRG, 3GRB, 3GPS and 3DGD, respectively). Note the nearly perfect overlap among the four subunits (A–B) of the four structures. B, ribbon diagrams showing the overall crystal structure of Zn2+-free M-TTR (green, PDB ID 1GKO (9)) aligned with the Zn2+:M-TTR complex at pH 7.5 (red, PDB ID 3GRG). Zn2+ ions are shown as gray spheres. ZBS 1–3 are also highlighted. C, plots of the Cα r.m.s.d. for the four monomeric subunits (A–D) of M-TTR, comparing equivalent subunits of Zn2+-free M-TTR (PDB ID 1GKO (9)) with Zn2+-bound M-TTR at pH 7.5 (PDB ID 3GRG). Major Zn2+-dependent differences are seen in the region of the α-helix and F-loop (residues 74–90).
FIGURE 2.
FIGURE 2.
Details of the three Zn2+-binding sites in TTR (ZBS 1–3), and a fourth site (ZBS 4) that is formed by amino acid residues from a symmetry-related tetramer. Close-up views of Zn2+-binding sites and schematic diagrams of Zn2+ coordination spheres. ZBS 1 is composed of Cys-10, His-56, and two water molecules (red spheres). ZBS 2 is composed of His-88, His-90, Glu-92, and one water molecule. ZBS 3 involves His31AU, Asp74AU and Glu72AU (at higher pH values) or Glu62symm (at pH4.6, ZBS 3′). ZBS 4 involves His31symm, Asp74symm, and Glu61AU in addition to water molecules (AU, asymmetric unit; symm, symmetry-related unit). Meshes are electron densities from 2 Fobs-Fcalc omit maps contoured at 1σ. The electron density displayed is limited to within 1.5 Å of the residues. Orange residues in ZBS 3 and ZBS 4 represent residues from neighboring tetramers of symmetrically related molecules in the crystal. The Zn2+-binding sites described here present the canonical constitution of other selective Zn2+-binding sites found in proteins (40).
FIGURE 3.
FIGURE 3.
A close-up view of the loop E-loop F region flanked by ZBS 2 and ZBS 3 shows major structural modifications when Zn2+ is bound. A, structures of the four subunits of TTR (ABCD; orange, red, blue, and yellow) obtained in the presence of Zn2+ at different pH are overlapped with the Zn2+-free structure (green). Note the movement of the α-helix residues as the pH decreases from pH 7.5 to 4.6, causing the helix to unwind and form an extended loop. B, close-up view of the ZBS 2 and 3 region, in green, the apo form and in red the structure obtained in the presence of Zn2+ at pH 7.5, where the structural alterations in the α-helix region are better seen. Residues in pink are those that undergo major reorientation upon Zn2+ binding. Zn2+ atoms are shown as gray spheres. C, Zn2+ binding to WT-TTR decreases its affinity for holo-RBP. Isothermal holo-RBP:WT-TTR binding assays were performed by measuring anisotropy changes that take place upon TTR binding to holo-RBP in the absence (●) or in the presence of 15 μm ZnCl2 (▼) and 50 μm ZnCl2 (■). Data are normalized to fraction of holo-RBP:TTR complex formed. The Kd values (inset, error bars show ± S.D.) were calculated as described under “Experimental Procedures.” D, size-exclusion chromatography demonstrates that WT-TTR remains a tetramer upon Zn2+ binding. The elution profiles of WT-TTR without (black line) and in the presence of 20 μm (red line) and 100 μm (green line) ZnCl2 are shown. T, elution time of tetrameric TTR; M, elution time of monomeric TTR.
FIGURE 4.
FIGURE 4.
Mapping Zn2+ binding to TTR by TROSY-HSQC measurements at pH 7.5. The chemical-shift perturbations (CSP) in the NMR spectrum of fully 15N-2H labeled WT-TTR (100 μm) were measured at different concentrations of ZnCl2. CSP derived from differences between a reference spectrum of WT-TTR in the absence of Zn2+ and the spectra in the presence of Zn2+ were obtained for: (A) 100 μm ZnCl2; (B) 200 μm ZnCl2; (C) 300 μm ZnCl2; (D) 400 μm ZnCl2; (E) 900 μm ZnCl2, and (F) 900 μm ZnCl2 + 1 mm EDTA. Blue bars are residues whose signal vanished during the experiment; red bars are non-assigned residues; gray bars are prolines. Images at the right show where CSP occurred in WT-TTR at each Zn2+ concentration, marked in red in a ribbon representation of Zn2+:TTR pH 7.5 (PDB ID 3GRG). For clarity, only one of the four monomers is marked. Zn2+ atoms are represented as gray spheres. CSP was calculated for each assigned main-chain amide using Equation 1. Dotted lines show the threshold for considering a CSP significant (0.025 ppm).
FIGURE 5.
FIGURE 5.
Mapping Zn2+ binding into TTR by TROSY-HNCO and TROSY-HNCA NMR measurements. Cα (upper plot) and carbonyl (lower plot) chemical-shift difference between the native WT-TTR and the random coil values (Δδ). Chemical shifts were derived from TROSY-HNCA and TROSY-HNCO spectra of WT-TTR in the absence and in the presence of 900 μm Zn2+. Δδ in the absence of Zn2+ are in black. Δδ in the presence of Zn2+ are colored red for Cα or in green for the carbonyl. Positive values of Δδ are typical of α-helix, while negative values are typical of the β-sheet. Note that Δδ for the residues comprising the α-helix remain unchanged in the presence of Zn2+, while those related to the nearby residues undergo perturbation (mainly the loop after the helix and the C-terminal of strand E). The resonance signal of these residues are missing probably because they are in conformational exchange, what can lead to the variation in the position of the α-helix observed in the crystal structure.
FIGURE 6.
FIGURE 6.
Zn2+ binding decreases monomer stability but is innocuous to the tetramers. WT-TTR (3.5 μm tetramers; panels A and C) or M-TTR (3.5 μm monomers; panels B and D) were subjected to denaturation by urea (panels A and B) or by high hydrostatic pressure (panels C and D) in Tris-HCl 25 mm, KCl 50 mm, pH 7.5 (25 °C) at varying ZnCl2 concentration (0–600 μM, as stated in the figure inset). The center of spectral mass of tryptophan emission of each spectrum was calculated and converted into the extent of reaction (α) as described under “Experimental Procedures” and plotted against the variables. From these plots and by using Equations 4 and 5, the ΔGunf (panel E) or the ΔV or munf parameters (panel F) for the unfolding of M-TTR were calculated. Circles represent urea denaturation and squares show HHP. Error bars in panels E and F are standard deviations obtained from non-linear regression analysis (most of them are smaller than the symbols). Details under “Experimental Procedures.”
FIGURE 7.
FIGURE 7.
Scheme of the main findings of the present study. In the plasma (upper panel), ZBS 1 of TTR is occupied with Zn2+ (gray spheres), and it does not elicit any major structural alteration in TTR conformation, allowing its tight interaction with holo-RBP (orange structure). In the presence of an increased concentration of Zn2+, ZBS 2 and 3 are occupied by Zn2+; this triggers a conformational change mainly in the neighborhood of the α-helix (blown-up image). In the plasma, this change in conformation displaces holo-RBP (upper panel), while in the peripheral nerves it leads to TTR aggregation and fibril formation (lower panel). The intermediate species, which are present in the pathway from Zn2+-bound tetramers into amyloid fibrils, are unknown.

Similar articles

Cited by

References

    1. Palha J. A. (2002) Clin. Chem. Lab. Med. 40, 1292–1300 - PubMed
    1. Monaco H. L. (2000) Biochim. Biophys. Acta 1482, 65–72 - PubMed
    1. Sekijima Y., Kelly J. W., Ikeda S. (2008) Curr. Pharm. Des. 14, 3219–3230 - PubMed
    1. Kingsbury J. S., Théberge R., Karbassi J. A., Lim A., Costello C. E., Connors L. H. (2007) Anal. Chem. 79, 1990–1998 - PubMed
    1. Inoue S., Kuroiwa M., Saraiva M. J., Guimarães A., Kisilevsky R. (1998) J. Struct. Biol. 124, 1–12 - PubMed

Publication types