

Disease variants of the human mitochondrial DNA helicase encoded by C10orf2 differentially alter protein stability, nucleotide hydrolysis, and helicase activity
- PMID: 20659899
- PMCID: PMC2943296
- DOI: 10.1074/jbc.M110.151795
Disease variants of the human mitochondrial DNA helicase encoded by C10orf2 differentially alter protein stability, nucleotide hydrolysis, and helicase activity
Abstract
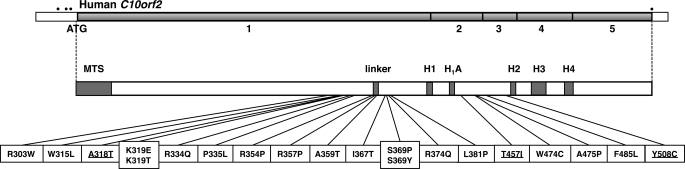
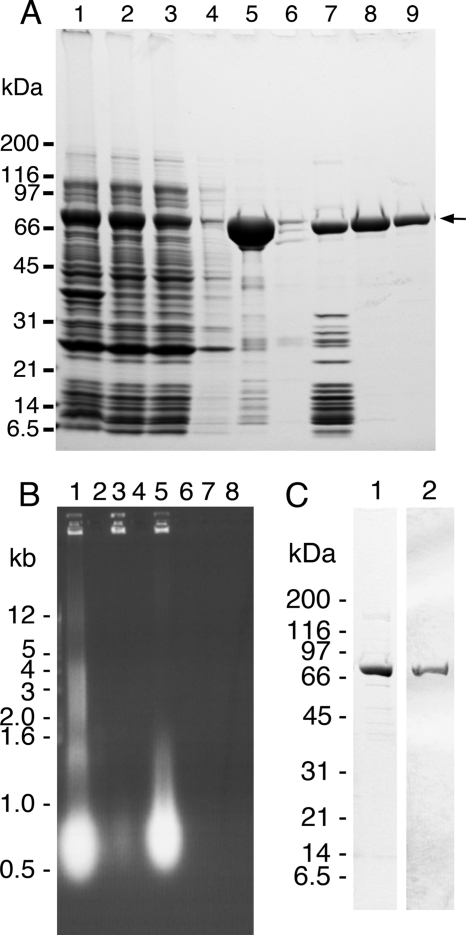
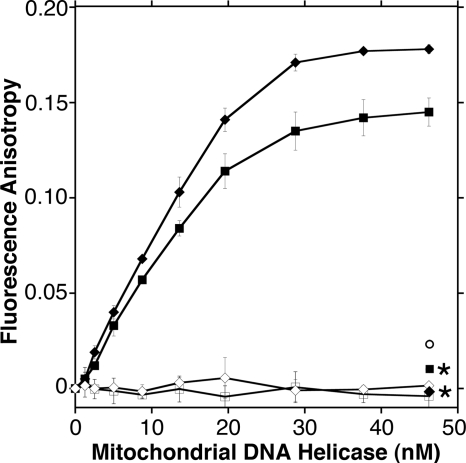
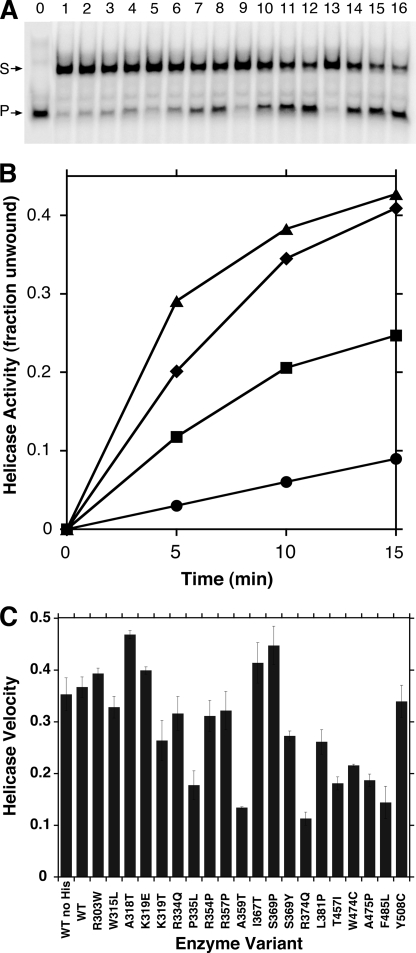
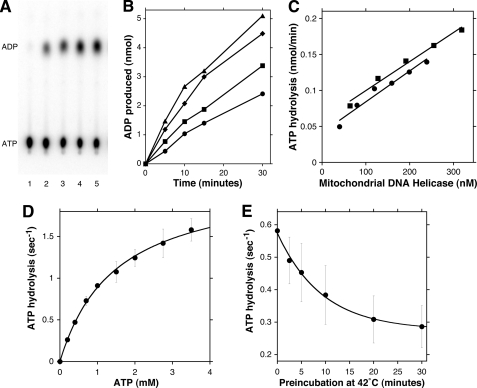
Missense mutations in the human C10orf2 gene, encoding the mitochondrial DNA (mtDNA) helicase, co-segregate with mitochondrial diseases such as adult-onset progressive external ophthalmoplegia, hepatocerebral syndrome with mtDNA depletion syndrome, and infantile-onset spinocerebellar ataxia. To understand the biochemical consequences of C10orf2 mutations, we overproduced wild type and 20 mutant forms of human mtDNA helicase in Escherichia coli and developed novel schemes to purify the recombinant enzymes to near homogeneity. A combination of molecular crowding, non-ionic detergents, Mg(2+) ions, and elevated ionic strength was required to combat insolubility and intrinsic instability of certain mutant variants. A systematic biochemical assessment of the enzymes included analysis of DNA binding affinity, DNA helicase activity, the kinetics of nucleotide hydrolysis, and estimates of thermal stability. In contrast to other studies, we found that all 20 mutant variants retain helicase function under optimized in vitro conditions despite partial reductions in DNA binding affinity, nucleotide hydrolysis, or thermal stability for some mutants. Such partial defects are consistent with the delayed presentation of mitochondrial diseases associated with mutation of C10orf2.
Figures
Similar articles
-
Modeling pathogenic mutations of human twinkle in Drosophila suggests an apoptosis role in response to mitochondrial defects.PLoS One. 2012;7(8):e43954. doi: 10.1371/journal.pone.0043954. Epub 2012 Aug 28. PLoS One. 2012. PMID: 22952820 Free PMC article.
-
Defects in mitochondrial DNA replication and human disease.Crit Rev Biochem Mol Biol. 2012 Jan-Feb;47(1):64-74. doi: 10.3109/10409238.2011.632763. Crit Rev Biochem Mol Biol. 2012. PMID: 22176657 Free PMC article. Review.
-
Determination of the biochemical properties of full-length human PIF1 ATPase.Prion. 2013 Jul-Aug;7(4):341-7. doi: 10.4161/pri.26022. Epub 2013 Aug 7. Prion. 2013. PMID: 23924759 Free PMC article.
-
Infantile-onset spinocerebellar ataxia and mitochondrial recessive ataxia syndrome are associated with neuronal complex I defect and mtDNA depletion.Hum Mol Genet. 2008 Dec 1;17(23):3822-35. doi: 10.1093/hmg/ddn280. Epub 2008 Sep 5. Hum Mol Genet. 2008. PMID: 18775955
-
TWINKLE and Other Human Mitochondrial DNA Helicases: Structure, Function and Disease.Genes (Basel). 2020 Apr 9;11(4):408. doi: 10.3390/genes11040408. Genes (Basel). 2020. PMID: 32283748 Free PMC article. Review.
Cited by
-
History of DNA Helicases.Genes (Basel). 2020 Feb 27;11(3):255. doi: 10.3390/genes11030255. Genes (Basel). 2020. PMID: 32120966 Free PMC article. Review.
-
Using Atomic Force Microscopy to Study the Real Time Dynamics of DNA Unwinding by Mitochondrial Twinkle Helicase.Bio Protoc. 2021 Sep 5;11(17):e4139. doi: 10.21769/BioProtoc.4139. eCollection 2021 Sep 5. Bio Protoc. 2021. PMID: 34604445 Free PMC article.
-
Human mitochondrial DNA helicase TWINKLE is both an unwinding and annealing helicase.J Biol Chem. 2012 Apr 27;287(18):14545-56. doi: 10.1074/jbc.M111.309468. Epub 2012 Mar 1. J Biol Chem. 2012. PMID: 22383523 Free PMC article.
-
Off-Target Effects of Drugs that Disrupt Human Mitochondrial DNA Maintenance.Front Mol Biosci. 2017 Nov 22;4:74. doi: 10.3389/fmolb.2017.00074. eCollection 2017. Front Mol Biosci. 2017. PMID: 29214156 Free PMC article. Review.
-
Human mitochondrial DNA polymerase γ exhibits potential for bypass and mutagenesis at UV-induced cyclobutane thymine dimers.J Biol Chem. 2012 Mar 16;287(12):9222-9. doi: 10.1074/jbc.M111.306852. Epub 2011 Dec 21. J Biol Chem. 2012. PMID: 22194617 Free PMC article.
References
-
- Suomalainen A., Kaukonen J., Amati P., Timonen R., Haltia M., Weissenbach J., Zeviani M., Somer H., Peltonen L. (1995) Nat. Genet. 9, 146–151 - PubMed
-
- Spelbrink J. N., Li F. Y., Tiranti V., Nikali K., Yuan Q. P., Tariq M., Wanrooij S., Garrido N., Comi G., Morandi L., Santoro L., Toscano A., Fabrizi G. M., Somer H., Croxen R., Beeson D., Poulton J., Suomalainen A., Jacobs H. T., Zeviani M., Larsson C. (2001) Nat. Genet. 28, 223–231 - PubMed
Publication types
MeSH terms
Substances
Grants and funding
LinkOut - more resources
Full Text Sources
Medical
