. 2010 Aug;133(Pt 8):2426-38.
doi: 10.1093/brain/awq155. Epub 2010 Jul 21.

Melanopsin retinal ganglion cells are resistant to neurodegeneration in mitochondrial optic neuropathies

Affiliations

Melanopsin retinal ganglion cells are resistant to neurodegeneration in mitochondrial optic neuropathies

Chiara La Morgia et al. Brain. 2010 Aug.

Abstract

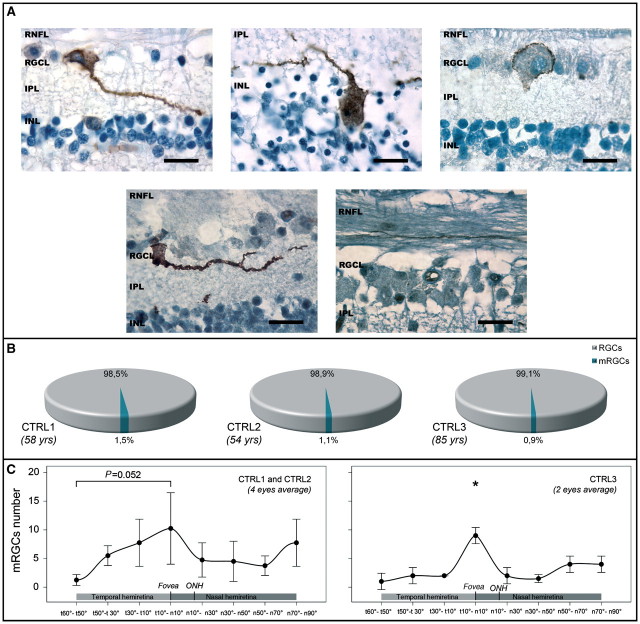
Mitochondrial optic neuropathies, that is, Leber hereditary optic neuropathy and dominant optic atrophy, selectively affect retinal ganglion cells, causing visual loss with relatively preserved pupillary light reflex. The mammalian eye contains a light detection system based on a subset of retinal ganglion cells containing the photopigment melanopsin. These cells give origin to the retinohypothalamic tract and support the non-image-forming visual functions of the eye, which include the photoentrainment of circadian rhythms, light-induced suppression of melatonin secretion and pupillary light reflex. We studied the integrity of the retinohypothalamic tract in five patients with Leber hereditary optic neuropathy, in four with dominant optic atrophy and in nine controls by testing the light-induced suppression of nocturnal melatonin secretion. This response was maintained in optic neuropathy subjects as in controls, indicating that the retinohypothalamic tract is sufficiently preserved to drive light information detected by melanopsin retinal ganglion cells. We then investigated the histology of post-mortem eyes from two patients with Leber hereditary optic neuropathy and one case with dominant optic atrophy, compared with three age-matched controls. On these retinas, melanopsin retinal ganglion cells were characterized by immunohistochemistry and their number and distribution evaluated by a new protocol. In control retinas, we show that melanopsin retinal ganglion cells are lost with age and are more represented in the parafoveal region. In patients, we demonstrate a relative sparing of these cells compared with the massive loss of total retinal ganglion cells, even in the most affected areas of the retina. Our results demonstrate that melanopsin retinal ganglion cells resist neurodegeneration due to mitochondrial dysfunction and maintain non-image-forming functions of the eye in these visually impaired patients. We also show that in normal human retinas, these cells are more concentrated around the fovea and are lost with ageing. The current results provide a plausible explanation for the preservation of pupillary light reaction despite profound visual loss in patients with mitochondrial optic neuropathy, revealing the robustness of melanopsin retinal ganglion cells to a metabolic insult and opening the question of mechanisms that might protect these cells.


Figures

Figure 1
Figure 1
(A) Retinal nerve fibre layer thickness evaluated by optical coherence tomography in optic neuropathy and control subjects. Average retinal nerve fibre layer (RNFL) thicknesses of temporal, superior, nasal and inferior quadrants are shown for control, LHON and DOA subjects. Retinal nerve fibre layer thickness was significantly lower in optic neuropathy subjects compared with controls in each quadrant. There were no statistical differences between LHON and DOA subjects except for superior retinal nerve fibre layer thickness, which was significantly lower in LHON subjects (P = 0.037). The average retinal nerve fibre layer thickness was 97.3 μm ± 8.4 in controls, 52 μm ± 9 in LHON and 59.3 μm ± 5.8 in DOA subjects. (B) Melatonin suppression test results in control and optic neuropathy subjects. Box plots of melatonin plasma levels at the four sampling times (00:30, 01:30, 02:30, 03:30 am) are shown for the baseline (dark grey) and light suppression (light grey) nights in control (CTRLs; left panel) and optic neuropathy (right panel) subjects. In the control group, a significant difference in melatonin plasma levels between the baseline and the test night was evident for the third (P = 0.000008) and fourth samples (P = 0.00015); this difference was also evident in optic neuropathy subjects for the third (P = 0.0018) and fourth (P = 0.0046) samples. Asterisks indicate these significant differences. (C) Melatonin suppression scores for controls and optic neuropathy subjects. Box plots of control-adjusted melatonin suppression score (caMSS), suppression rate and absolute difference (%) scores are shown for control (dark grey) and optic neuropathy (ON; light grey) subjects in the left, middle and right panels, respectively. No statistical differences were evident between groups, demonstrating similar magnitude of light-induced melatonin suppression.
Figure 2
Figure 2
(A) Melanopsin retinal ganglion cells in control retinas. Upper line: (left) one example of a brown-stained mRGC located in the RGC layer is shown including the large cell body with the nucleus and a dendrite running at the border of the inner nuclear layer; (middle) a brown-stained mRGC located in the inner nuclear layer is depicted; (right) the peripheral staining of melanopsin under the plasma membrane is evident in this mRGC located in the RGC layer. Lower line: (left) one example of a long dendrite running close to the RGC layer is shown; (right) one example of a thin axon filled with brown-stained melanopsin in the retinal nerve fibre layer is depicted (scale bar represents 20 µm). (B) Ratio of mRGCs relative to the total number of RGCs in control retinas. The ratio of mRGCs relative to the total number of RGCs is shown for Control 1 (left), Control 2 (middle) and Control 3 (right), respectively. (C) Retinal distribution of mRGCs in control subjects. Distributions of mRGCs in four eyes from averaged Controls 1 and 2 (left) and in the two eyes from Control 3 (right) are shown. The mean number of mRGCs (± SD) is reported for each 20° sector of the temporal and nasal hemiretinas, centred to the fovea. Mean number of mRGCs in parafoveal sector (t10°−n10°) is greater in the two younger controls, being close to statistical significance with respect to the far temporal hemiretina (P = 0.052). In the oldest, Control 3, the number of mRGCs in parafoveal sector (t10°−n10°) is also greater and significantly different (P = 0.05) with respect to all sectors except for n50°−n70° and n70°−n90° (t10°−n10° versus: t60°−t50° P = 0.01; t50°−t30° P = 0.024; t30°−t10° P = 0.024; n10°−n30° P = 0.024; n30°−n50° P = 0.015). RNFL = retinal nerve fibre layer; RGCL = retinal ganglion cell layer; IPL = inner plexiform layer; INL = inner nuclear layer.
Figure 3
Figure 3
(A) Ocular findings in the mild LHON case (mLHON). Upper line, on the left the oculus destrum (OD) fundus with moderate temporal pallor of the optic disc is shown; on the right the oculus sinistrum (OS) fundus is characterized by a more severe sectorial temporal pallor of the optic disc. Middle line, on the left oculus destrum optic nerve cross-section shows severe depletion of axonal bundles involving the temporal fibres; on the right oculus sinistrum optic nerve cross-section reveals more extended depletion of axonal bundles involving the temporal fibres (scale bar represents 1 mm). Lower line, on the left, high-magnification images of nasal axonal bundles demonstrate high, virtually normal axonal density, whereas in the middle the transition zone is characterized by intermediate axonal density, and on the right, the temporal sector shows low axonal density (scale bar represents 20 µm). Axons are identified as myelin profiles stained by paraphenylenediamine on semithin sections cut from plastic-embedded tissue (see ‘Materials and methods’ section). (B) Ocular findings in the severe optic atrophy case (sLHON). Upper line, funduscopic images show complete optic atrophy on both oculus destrum (left) and oculus sinistrum (right). Middle line, oculus destrum (left) and oculus sinistrum (right) optic nerve cross-sections reveal diffuse and severe depletion of axonal bundles involving the entire optic nerve with some preservation of the nasal bundles (scale bar represents 1 mm). Lower line, high-magnification images of nasal axonal bundles demonstrate depleted axonal density (left), whereas the transition zone reveals low axonal density (middle) and the temporal sector shows very low axonal density (scale bar represents 20 µm). Axons are identified as myelin profiles stained by paraphenylenediamine on semithin sections cut from plastic-embedded tissue (see ‘Materials and methods’ section). (C) Ocular findings in the DOA case. Upper line, funduscopic images show complete optic atrophy on both oculus destrum (left) and oculus sinistrum (right). Middle line, OS optic nerve cross-section shows diffuse and very severe depletion of axonal bundles involving the entire optic nerve (scale bar represents 1 mm). Lower line, images at increasing magnification show the axonal depletion of spared bundles in the central area of the optic nerve cross-section (scale bars represent, respectively, 100, 50 and 20 µm). Axons are identified as axoplasm immunostained for neurofilaments on sections cut from paraffin tissue blocks (see ‘Materials and methods’ section).
Figure 4
Figure 4
(A) Melanopsin cells in control and optic neuropathy retinas. In the upper line, examples of brown-stained mRGCs located both in the RGC layer and in the inner nuclear layer for all three controls are provided (scale bar represents 60 µm). The Control 3 sections were stained by immunofluorescence and all nuclei are red, whereas melanopsin is green (scale bar represents 50 µm). Single to multilayered RGCs are shown in these pictures. In the lower line, examples of brown-stained mRGCs located in the RGC layer in all three optic neuropathy subjects are shown (scale bar represents 60 µm). Their persistence is remarkable despite the complete absence of the other RGCs. The DOA sections were stained by immunofluorescence and all nuclei are red, whereas melanopsin is green (scale bar represents 25 µm). (B) Axonal (RGCs) and mRGC count, and mRGC/RGC ratio for control, LHON and DOA subjects. On left, histograms of axonal counts for averaged Controls 1 and 2, mild LHON (mLHON), severe LHON (sLHON), Control 3 and DOA subjects are shown demonstrating a severe loss of axons in optic neuropathy subjects. In the middle, histograms of mRGC counts for averaged Controls 1 and 2, mild LHON, severe LHON, Control 3 and DOA subjects are shown revealing a relative preservation of mRGCs in the optic neuropathy subjects as compared with the severe rate of axonal loss, which equals total RGCs. On the right, the ratio of mRGCs relative to the total number of RGCs is shown for averaged Controls 1 and 2, and Control 3 (upper line), and for mild LHON, severe LHON and DOA subjects (lower line). In the optic neuropathy subjects there is a striking increase in the rate of mRGCs, which is inversely correlated with the severity of RGC loss, indicating their relative preservation. (C) Retinal distribution of mRGCs in subjects with optic neuropathy. Distributions of mRGCs in four eyes from averaged mild LHON and severe LHON (left) and one eye from DOA (right) are shown. The mean number of mRGCs (±SD) is reported for each 20°sector of temporal and nasal hemiretinas, centred on the fovea. Mean number of mRGCs in parafoveal sector (t10°−n10°) is greater in the two LHON subjects, being significantly different compared with the sectors t60°−t50°, t50°−t30° and n50°−n70° (P = 0.002, 0.04 and 0.008, respectively). In the DOA case the number of mRGCs is uniformly distributed, lacking a parafoveal peak. (D) Overall retinal distribution of mRGCs in control and optic neuropathy subjects. The distribution of mRGCs for each eye of Controls 1–3 and for mild LHON, severe LHON and DOA cases are shown. The relative size of the black circles represent the number of mRGCs for each 5° sector (the x-axis shows the fovea as point 0 and the other sectors as relative to the centre, being negative for the temporal hemiretina and positive for the nasal hemiretina). In the last line the cumulative distribution of mRGCs is reported for all controls, all optic neuropathy subjects and merged for everybody. OD = oculus destrum; OS = oculus sinistrum.

Similar articles

Cited by

References

    1. Baver SB, Pickard GE, Sollars PJ, Pickard GE. Two types of melanopsin retinal ganglion cell differentially innervate the hypothalamic suprachiasmatic nucleus and the olivary pretectal nucleus. Eur J Neurosci. 2008;27:1763–70. - PubMed
    1. Berson DM, Dunn FA, Takao M. Phototransduction by retinal ganglion cells that set the circadian clock. Science. 2002;295:1070–3. - PubMed
    1. Bose S, Dhillon N, Ross-Cisneros FN, Carelli V. Relative post-mortem sparing of afferent pupil fibers in a patient with 3460 Leber's hereditary optic neuropathy. Graefes Arch Clin Exp Ophthalmol. 2005;243:1175–9. - PubMed
    1. Brainard GC, Hanifin JP, Greeson JM, Byrne B, Glickman G, Gerner E, et al. Action spectrum for melatonin regulation in humans: evidence for a novel circadian photoreceptor. J Neurosci. 2001;21:6405–12. - PMC - PubMed
    1. Bremner FD, Shallo-Hoffmann J, Riordan-Eva P, Smith SE. Comparing pupil function with visual function in patients with Leber's hereditary optic neuropathy. Invest Ophthalmol Vis Sci. 1999;40:2528–34. - PubMed

Publication types

MeSH terms