. 2010 Sep 1;137(17):2829-39.
doi: 10.1242/dev.042119. Epub 2010 Jul 21.

Temporal specification of blood progenitors from mouse embryonic stem cells and induced pluripotent stem cells

Affiliations

Temporal specification of blood progenitors from mouse embryonic stem cells and induced pluripotent stem cells

Stefan Irion et al. Development. .

Abstract

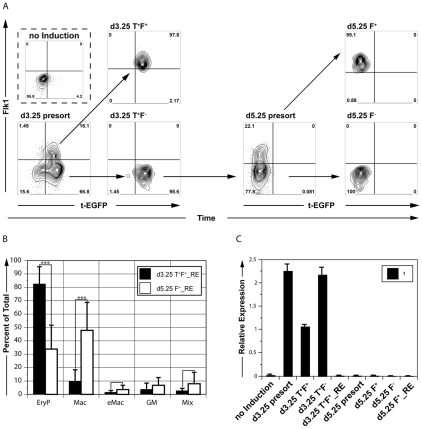
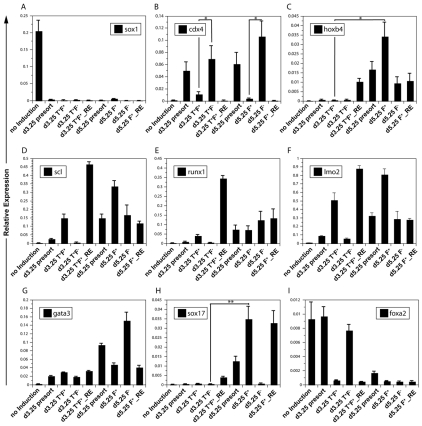
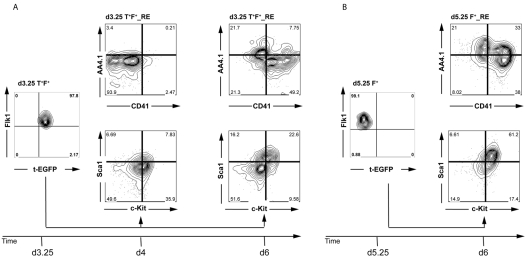
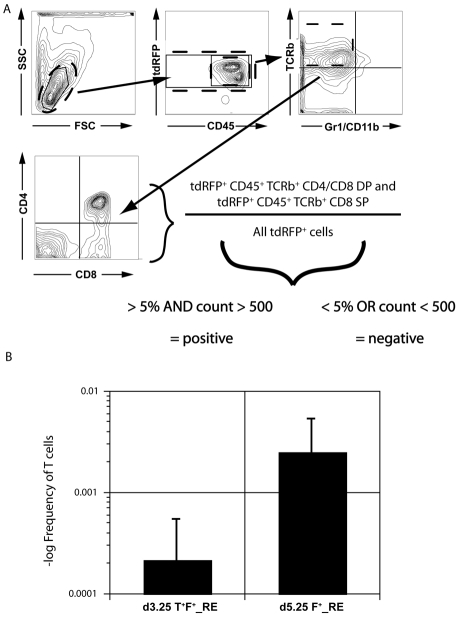
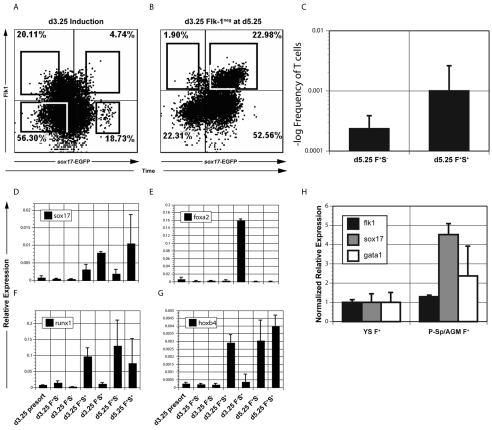
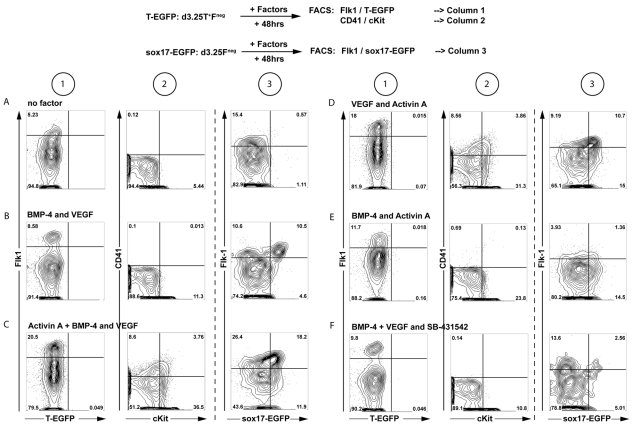
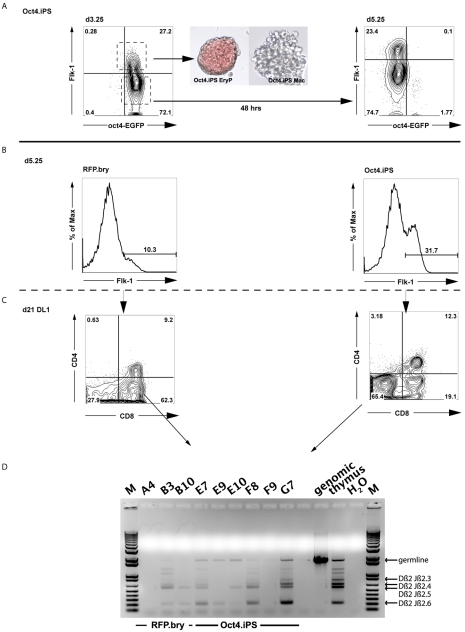
The efficient and reproducible generation of differentiated progenitors from pluripotent stem cells requires the recapitulation of appropriate developmental stages and pathways. Here, we have used the combination of activin A, BMP4 and VEGF under serum-free conditions to induce hematopoietic differentiation from both embryonic and induced pluripotent stem cells, with the aim of modeling the primary sites of embryonic hematopoiesis. We identified two distinct Flk1-positive hematopoietic populations that can be isolated based on temporal patterns of emergence. The earliest arising population displays characteristics of yolk sac hematopoiesis, whereas a late developing Flk1-positive population appears to reflect the para-aortic splanchnopleura hematopoietic program, as it has reduced primitive erythroid capacity and substantially enhanced myeloid and lymphoid potential compared with the earlier wave. These differences between the two populations are accompanied by differences in the expression of Sox17 and Hoxb4, as well as in the cell surface markers AA4.1 and CD41. Together, these findings support the interpretation that the two populations are representative of the early sites of mammalian hematopoiesis.


Figures

Fig. 1.
Fig. 1.
Induction of two distinct Flk1pos hematopoietic precursor populations from mouse ESCs using activin A, BMP4 and VEGF. (A) To the left are shown T-EGFP and Flk1 expression in day (d) 3.25 embryoid bodies (EBs) cultured in the absence (no induction) or presence (d3.25 presort) of inducers. The d3.25 population was segregated into d3.25 T+ F+ and d3.25 T+ F fractions by cell sorting (T, brachyury; F, Flk1). The d3.25 T+ F cells were cultured as aggregates for 48 hours and the d5.25 F+ and F fractions isolated (shown to the right). (B) Hematopoietic progenitor potential of the d3.25 T+ F+ and d5.25 F+ populations aggregated for 24 hours and cultured in methylcellulose cultures. Primitive erythroid colonies (EryP) were scored at day 5 of culture, whereas the macrophage (Mac), erythroid-macrophage (eMac), granulocyte-macrophage (GM) and mixed (Mix) colonies were counted at days 7-8. Data are expressed as the mean of six independent experiments; error bars indicate ±s.d. ***, P<0.0002. (C) qRT-PCR analysis of T expression in all populations shown in A. d3.25 T+ F+_RE indicates d3.25 T+ F+ cells reaggregated for 24 hours; d5.25 T+ F+_RE indicates d5.25 F+ cells reaggregated for 24 hours. Data are presented as expression relative to that of the housekeeping gene Actb and are the mean of three independent experiments; error bars indicate ±s.d.
Fig. 2.
Fig. 2.
Gene expression analyses of different progenitor populations. (A-I) The sorted cell populations isolated in Fig. 1 were analyzed for the expression of the indicated genes by qRT-PCR. Data are presented as expression relative to that of Actb and are the mean of three independent experiments; error bars indicate ±s.d. *, P<0.2; **, P<0.01.
Fig. 3.
Fig. 3.
Phenotypic analyses of the populations derived from the two Flk1pos populations. (A) Analysis of d3.25 Flk1pos-derived populations cultured for either 1 day in the presence of KL and VEGF (d4) or for 2 days in activin, BMP4 and VEGF and then for 1 day in kit ligand (KL) and VEGF (d6). (B) Analysis of d5.25 Flk1pos-derived populations cultured for 1 day in the presence of KL and VEGF. Data are representative of two independent experiments and gates were set on unstained controls.
Fig. 4.
Fig. 4.
T cell potential of the Flk1pos progenitors. (A,B) d3.25 T+ F+_RE or d5.25 F+_RE cells generated from a T-EGFP ESC line expressing tdRFP were seeded over a range of densities on OP9-DL1 stroma cells and cultured for 3 weeks. Media were changed every week. Following culture, the cells were harvested, stained and (A) analyzed for expression of CD45, TCRβ, CD4 and CD8 by flow cytometry and (B) the frequency of T cell progenitors in the two populations (1/4680 for d3.25 versus 1/401 for d5.25) determined. Positive wells were those that contained at least 500 tdRFP+ cells (as a measure of total deposition), of which more than 5% expressed T cell markers as defined by the expression of both CD45+ and TCRβ+ and either CD8 alone or both CD4 and CD8. The frequency of T cell progenitors was then determined using L-Calc software (Stem Cell Technologies). Data are presented as the frequency of T cell progenitors and graphed on a logarithmic scale (n=6).
Fig. 5.
Fig. 5.
Isolation of Sox17-EGFP-positive cells from d3.25 and d5.25 populations. (A) Flow cytometric analyses showing Flk1 and Sox17-EGFP expression in d3.25 EBs. The four fractions indicated by the black boxes (d3.25 F+ S, d3.25 F S, d3.25 F+ S+ and d3.25 F S+; F, Flk1; S, Sox17) were isolated by cell sorting. (B) Flow cytometric analyses showing Flk1 and Sox17-EGFP expression in the d5.25 reaggregated population. Boxes indicate the Flk1pos populations (d5.25 F+ S+ and d5.25 F+ S) isolated by cell sorting. (C) d5.25 F+ S+ and d5.25 F+ S cells were plated in the limiting dilution OP9-DL1 co-culture assay for 3 weeks. The cells were then harvested and analyzed for the expression of T cell markers. (D-G) The sorted cell populations isolated in A and B were analyzed for the expression of the indicated genes by qRT-PCR. Data are presented as expression relative to that of Actb and are the mean of two independent experiments; error bars indicate ±s.d. (H) Flk1pos cells were isolated from E9.0 mouse embryos by flow cytometric cell sorting. Samples were analyzed for the expression of the indicated genes by qRT-PCR. Expression was standardized to that of Actb and are presented relative to the value found in the yolk sac (set at 1). Data shown are the mean of three independent experiments; error bars indicate ±s.d.
Fig. 6.
Fig. 6.
Effect of activin A, BMP4 and VEGF on the generation of the secondary Flk1pos population. d3.25 T+ F cells generated from either T-EGFP ESCs (columns 1+2) or Sox17-EGFP ESCs (column 3) were isolated, reaggregated in the indicated conditions for 48 hours and then analyzed for expression of T-EGFP, Sox17-EGFP, Flk1, c-Kit and CD41 (see schematic overview, top). SB-431542 is a small-molecule inhibitor of TGF-β1/activin/nodal signaling. BMP4, 10 ng/ml; activin A, 3ng/ml; VEGF, 5ng/ml; SB-431542, 6 μM final concentration. (A) StemPro 34 (SP34) media alone. (B-F) Reaggregation in the presence of (B) BMP4 and VEGF; (C) Activin A, BMP4 and VEGF; (D) VEGF and activin A; (E) BMP4 and activin A; (F) BMP4, VEGF and SB-431542. Quadrant labels were removed if zero (n=2 for both cell lines).
Fig. 7.
Fig. 7.
Generation and characterization of Flk1pos populations from iPSCs. (A) Oct4-EGFP iPSCs were differentiated in the presence of activin A, BMP4 and VEGF. Flk1pos and Flk1neg cells isolated at d3.25. Flk1pos cells were reaggregated for 24 hours and their hematopoietic potential was tested in a colony-forming assay. A primitive erythroid (EryP) and a macrophage (Mac) colony are shown, generated from the d3.25 Flk1pos population (40× magnification). Flk1neg cells were reaggregated for 48 hours and analyzed by flow cytometry at d5.25 for the emergence of a secondary Flk1pos population. (B) Flow cytometric analyses demonstrating the presence of an Flk1pos population in d5.25 aggregates generated from Oct4-EGFP iPSCs and tdRFP/T-EGFP (RFP.bry) cells. Both cell types were differentiated in the presence of activin A, BMP4 and VEGF. After dissociation at d3.25, the cells were reaggregated without cell sorting and cultured for an additional 48 hours, at which time they were sorted based on the expression of Flk1. (C) Flow cytometric profile demonstrating the generation of CD4+ CD8+ lymphocytes from the d5.25 Flk1pos ESC- and iPSC-derived progenitors following culture on OP9-Dl1 cells for 3 weeks. (D) PCR analyses showing T cell receptor gene rearrangements in the developing T cell populations from either the ESC progenitors (B3, B10) or the iPSC progenitors (E7, E9, E10, F8 and G7). M, 1 kb DNA ladder.

Similar articles

Cited by

References

    1. Bertrand J. Y., Giroux S., Golub R., Klaine M., Jalil A., Boucontet L., Godin I., Cumano A. (2005). Characterization of purified intraembryonic hematopoietic stem cells as a tool to define their site of origin. Proc. Natl. Acad. Sci. USA 102, 134-139 - PMC - PubMed
    1. Bertrand J. Y., Chi N. C., Santoso B., Teng S., Stainier D. Y., Traver D. (2010). Haematopoietic stem cells derive directly from aortic endothelium during development. Nature 464, 108-111 - PMC - PubMed
    1. Boisset J. C., van Cappellen W., Andrieu-Soler C., Galjart N., Dzierzak E., Robin C. (2010). In vivo imaging of haematopoietic cells emerging from the mouse aortic endothelium. Nature 464, 116-120 - PubMed
    1. Cho S. K., Webber T. D., Carlyle J. R., Nakano T., Lewis S. M., Zuniga-Pflucker J. C. (1999). Functional characterization of B lymphocytes generated in vitro from embryonic stem cells. Proc. Natl. Acad. Sci. USA 96, 9797-9802 - PMC - PubMed
    1. Cho S. K., Bourdeau A., Letarte M., Zuniga-Pflucker J. C. (2001). Expression and function of CD105 during the onset of hematopoiesis from Flk1(+) precursors. Blood 98, 3635-3642 - PubMed

Publication types

MeSH terms