

Association between common variation in genes encoding sweet taste signaling components and human sucrose perception
- PMID: 20660057
- PMCID: PMC2924427
- DOI: 10.1093/chemse/bjq063
Association between common variation in genes encoding sweet taste signaling components and human sucrose perception
Abstract
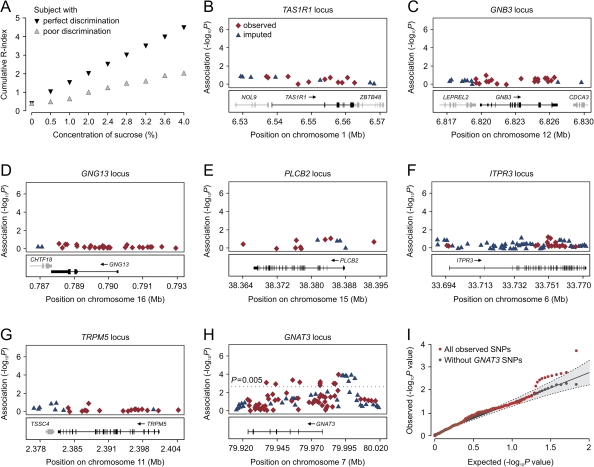
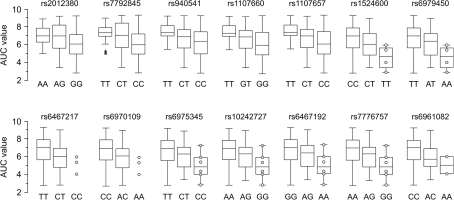
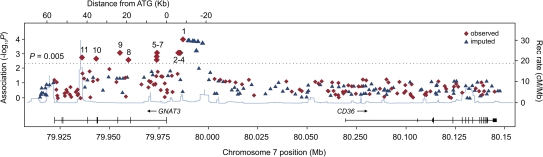
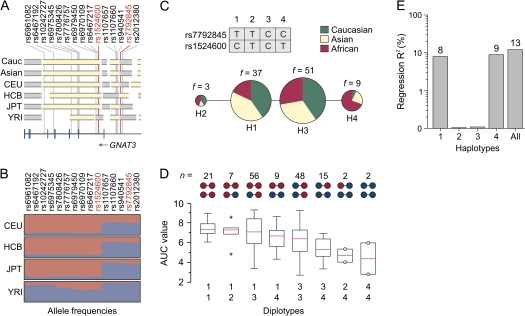
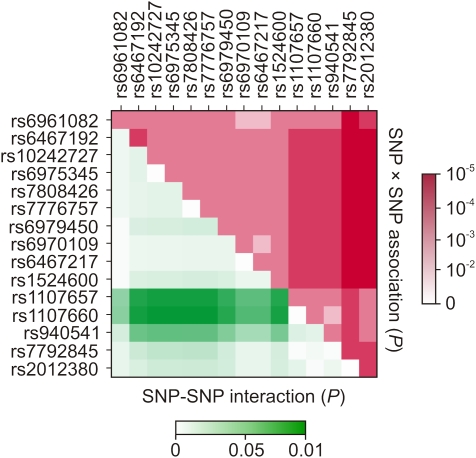
Variation in taste perception of different chemical substances is a well-known phenomenon in both humans and animals. Recent advances in the understanding of sweet taste signaling have identified a number of proteins involved in this signal transduction. We evaluated the hypothesis that sequence variations occurring in genes encoding taste signaling molecules can influence sweet taste perception in humans. Our population consisted of unrelated individuals (n = 160) of Caucasian, African-American, and Asian descent. Threshold and suprathreshold sensitivities of participants for sucrose were estimated using a sorting test and signal detection analysis that produced cumulative R-index area under the curve (AUC) scores. Genetic association analysis revealed significant correlation of sucrose AUC scores with genetic variation occurring in the GNAT3 gene (single point P = 10(-3) to 10(-4)), which encodes the taste-specific G(alpha) protein subunit gustducin. Subsequent sequencing identified additional GNAT3 variations having significant association with sucrose AUC scores. Collectively, GNAT3 polymorphisms explain 13% of the variation in sucrose perception. Our findings underscore the importance of common genetic variants influencing human taste perception.
Figures
Comment in
-
Gustation genetics: sweet gustducin!Chem Senses. 2010 Sep;35(7):549-50. doi: 10.1093/chemse/bjq059. Epub 2010 Jul 21. Chem Senses. 2010. PMID: 20660058 Free PMC article.
Similar articles
-
Gustation genetics: sweet gustducin!Chem Senses. 2010 Sep;35(7):549-50. doi: 10.1093/chemse/bjq059. Epub 2010 Jul 21. Chem Senses. 2010. PMID: 20660058 Free PMC article.
-
Worldwide diversity, association potential, and natural selection in the superimposed taste genes, CD36 and GNAT3.Chem Senses. 2022 Jan 1;47:bjab052. doi: 10.1093/chemse/bjab052. Chem Senses. 2022. PMID: 34972209
-
Allelic Variation in Taste Genes Is Associated with Taste and Diet Preferences and Dental Caries.Nutrients. 2019 Jun 29;11(7):1491. doi: 10.3390/nu11071491. Nutrients. 2019. PMID: 31261961 Free PMC article.
-
Human taste genetics.Annu Rev Genomics Hum Genet. 2005;6:217-35. doi: 10.1146/annurev.genom.6.080604.162340. Annu Rev Genomics Hum Genet. 2005. PMID: 16124860 Review.
-
Critically evaluating sweet taste receptor expression and signaling through a molecular pharmacology lens.FEBS J. 2021 Apr;288(8):2660-2672. doi: 10.1111/febs.15768. Epub 2021 Mar 6. FEBS J. 2021. PMID: 33590961 Review.
Cited by
-
Single Nucleotide Polymorphisms in Close Proximity to the Fibroblast Growth Factor 21 (FGF21) Gene Found to Be Associated with Sugar Intake in a Swedish Population.Nutrients. 2021 Nov 5;13(11):3954. doi: 10.3390/nu13113954. Nutrients. 2021. PMID: 34836209 Free PMC article.
-
Variation in the Sweet Taste Receptor Gene and Dietary Intake in a Swedish Middle-Aged Population.Front Endocrinol (Lausanne). 2017 Dec 13;8:348. doi: 10.3389/fendo.2017.00348. eCollection 2017. Front Endocrinol (Lausanne). 2017. PMID: 29326656 Free PMC article.
-
Salty taste acuity is affected by the joint action of αENaC A663T gene polymorphism and available zinc intake in young women.Nutrients. 2013 Dec 5;5(12):4950-63. doi: 10.3390/nu5124950. Nutrients. 2013. PMID: 24317554 Free PMC article.
-
Oral Microbiota Profile Associates with Sugar Intake and Taste Preference Genes.Nutrients. 2020 Mar 3;12(3):681. doi: 10.3390/nu12030681. Nutrients. 2020. PMID: 32138214 Free PMC article. Clinical Trial.
-
TAS1R3 and TAS2R38 Polymorphisms Affect Sweet Taste Perception: An Observational Study on Healthy and Obese Subjects.Nutrients. 2022 Apr 20;14(9):1711. doi: 10.3390/nu14091711. Nutrients. 2022. PMID: 35565677 Free PMC article.
References
-
- An P, Freedman BI, Hanis CL, Chen YD, Weder AB, Schork NJ, Boerwinkle E, Province MA, Hsiung CA, Wu X, et al. Genome-wide linkage scans for fasting glucose, insulin, and insulin resistance in the National Heart, Lung, and Blood Institute Family Blood Pressure Program: evidence of linkages to chromosome 7q36 and 19q13 from meta-analysis. Diabetes. 2005;54:909–914. - PubMed
-
- Arya R, Blangero J, Williams K, Almasy L, Dyer TD, Leach RJ, O'Connell P, Stern MP, Duggirala R. Factors of insulin resistance syndrome–related phenotypes are linked to genetic locations on chromosomes 6 and 7 in nondiabetic Mexican-Americans. Diabetes. 2002;51:841–847. - PubMed
-
- Barrett JC, Fry B, Maller J, Daly MJ. Haploview: analysis and visualization of LD and haplotype maps. Bioinformatics. 2005;21:263–265. - PubMed
Publication types
MeSH terms
Substances
Grants and funding
LinkOut - more resources
Full Text Sources
Other Literature Sources
Molecular Biology Databases
