. 2010:2:591-601.
doi: 10.1093/gbe/evq043. Epub 2010 Jul 21.

Gene duplication and environmental adaptation within yeast populations

Affiliations

Gene duplication and environmental adaptation within yeast populations

Ryan M Ames et al. Genome Biol Evol. 2010.

Abstract

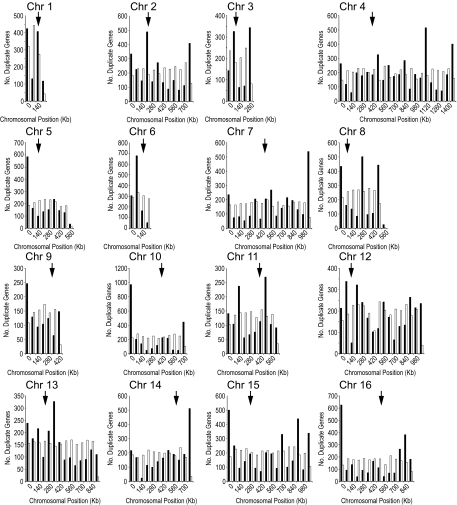
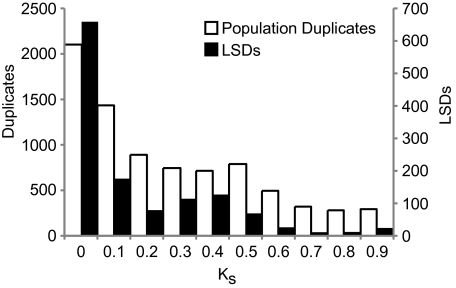
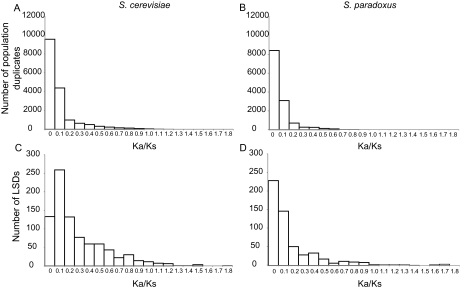
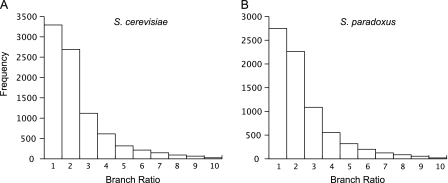
Population-level differences in the number of copies of genes resulting from gene duplication and loss have recently been recognized as an important source of variation in eukaryotes. However, except for a small number of cases, the phenotypic effects of this variation are unknown. Data from the Saccharomyces Genome Resequencing Project permit the study of duplication in genome sequences from a set of individuals within the same population. These sequences can be correlated with available information on the environments from which these yeast strains were isolated. We find that yeast show an abundance of duplicate genes that are lineage specific, leading to a large degree of variation in gene content between individual strains. There is a detectable bias for specific functions, indicating that selection is acting to preferentially retain certain duplicates. Most strikingly, we find that sets of over- and underrepresented duplicates correlate with the environment from which they were isolated. Together, these observations indicate that gene duplication can give rise to substantial phenotypic differences within populations that in turn can offer a shortcut to evolutionary adaptation.


Figures

F<sc>IG</sc>. 1.—
FIG. 1.—
Chromosomal distribution of duplicate genes. The graphs show the distribution of duplicate genes (black) and randomly generated duplicate genes (white) for 16 Saccharomyces cerevisiae chromosomes. Arrows indicate positions of centromeres.
F<sc>IG</sc>. 2.—
FIG. 2.—
The age of population duplicates (white) and LSDs (black) is measured by the number of synonymous mutations (Ks). A higher value of Ks indicates that the duplicate genes have diverged and are therefore older. Genes from both Saccharomyces cerevisiae and S. paradoxus are shown.
F<sc>IG</sc>. 3.—
FIG. 3.—
Signs of selection acting on duplicate genes. (A) The number of Saccharomyces cerevisiae duplicate genes; (B) the number of S. paradoxus duplicates; (C) the number of S. cerevisiae LSDs; and (D) the number of S. paradoxus LSDs. Here selection is measured by the ratio of nonsynonymous (Ka) to synonymous mutations (Ks). A higher Ka/Ks ratio indicates that one member of a duplicate pair has more nonsynonymous substitutions.
F<sc>IG</sc>. 4.—
FIG. 4.—
The distribution branch length ratios for (A) Saccharomyces cerevisiae and (B) S. paradoxus. The branch ratio is defined as the ratio between the branch lengths on a phylogenetic tree of each duplicate pair rooted by a Kluyveromyces waltii outgroup.
F<sc>IG</sc>. 5.—
FIG. 5.—
Phenetic and phylogenetic trees for Saccharomyces cerevisiae and S. paradoxus. (A) The 21 S. cerevisiae strains with over- or underrepresented “Biological Process” GO terms. (B) The 18 S. paradoxus strains with over- or underrepresented “Biological Process” GO terms. Distances between strains were determined using the semantic distance between the over- and underrepresented “Biological Process” GO terms of each strain. Branches leading to each strain were then colored according to environmental background. Strains from similar backgrounds have similar overrepresented GO terms, indicating selection for similar types of duplicate genes. (C) Phylogenetic for all S. cerevisiae strains. (D) Phylogenetic tree for all S. paradoxus strains. Phylogenetic trees are taken from Liti et al. (2009) and are based on single nucleotide polymorphism data.

Similar articles

Cited by

References

    1. Altschul SF, Gish W, Miller W, Myers EW, Lipman DJ. Basic local alignment search tool. J Mol Biol. 1990;215:403–410. - PubMed
    1. Ashburner M, et al. Gene ontology: tool for the unification of biology. The Gene Ontology Consortium. Nat Genet. 2000;25:25–29. - PMC - PubMed
    1. Barton AB, Pekosz MR, Kurvathi RS, Kaback DB. Meiotic recombination at the ends of chromosomes in Saccharomyces cerevisiae. Genetics. 2008;179:1221–1235. - PMC - PubMed
    1. Brown CA, Murray AW, Verstrepen KJ. Rapid expansion and functional divergence of subtelomeric gene families in yeasts. Curr Biol. 2010;20:895–903. - PMC - PubMed
    1. Byrne KP, Wolfe KH. The Yeast Gene Order Browser: combining curated homology and syntenic context reveals gene fate in polyploid species. Genome Res. 2005;15:1456–1461. - PMC - PubMed

Publication types