. 2010 Oct;51(10):3074-87.
doi: 10.1194/jlr.D008532. Epub 2010 Jul 21.

Blood sphingolipidomics in healthy humans: impact of sample collection methodology

Affiliations

Blood sphingolipidomics in healthy humans: impact of sample collection methodology

Samar M Hammad et al. J Lipid Res. 2010 Oct.

Abstract

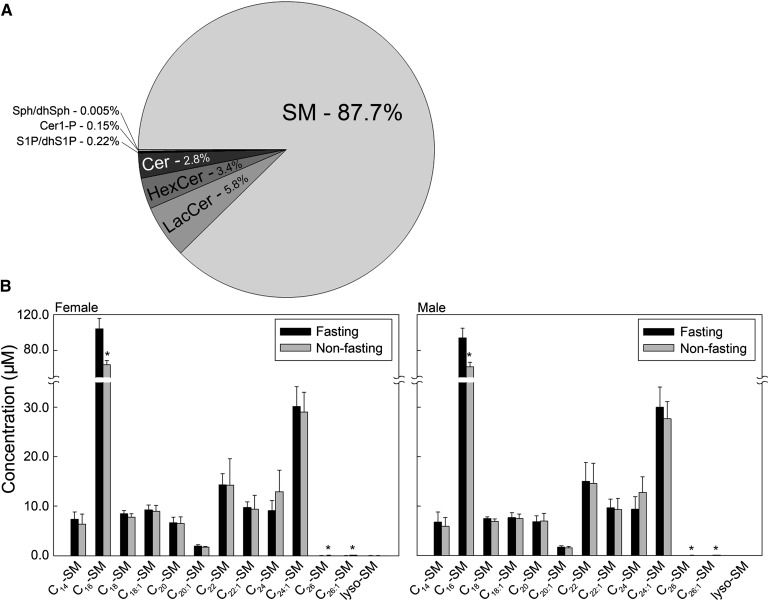
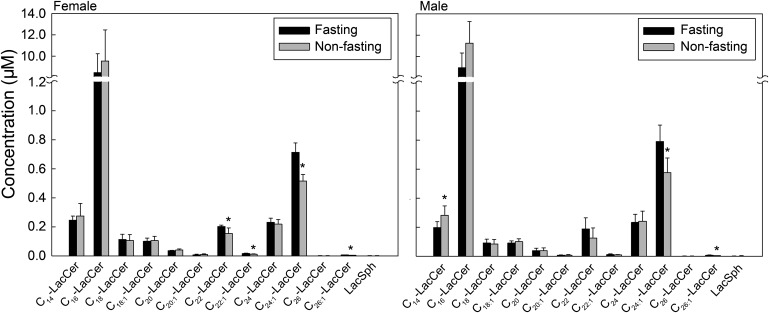
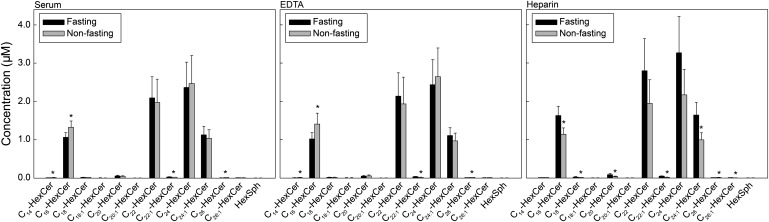
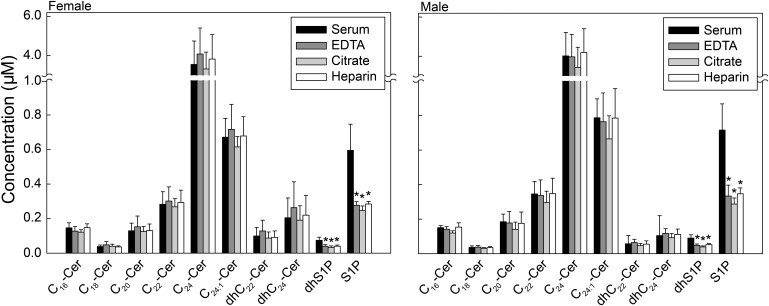
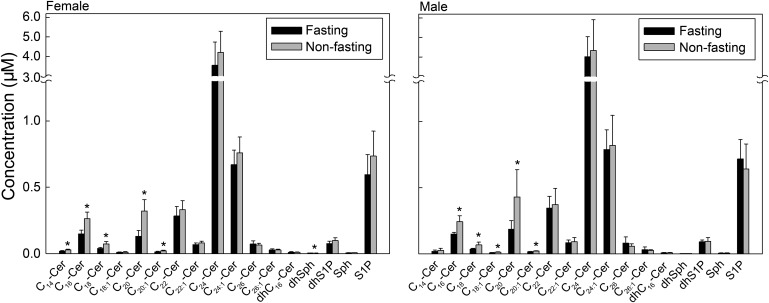
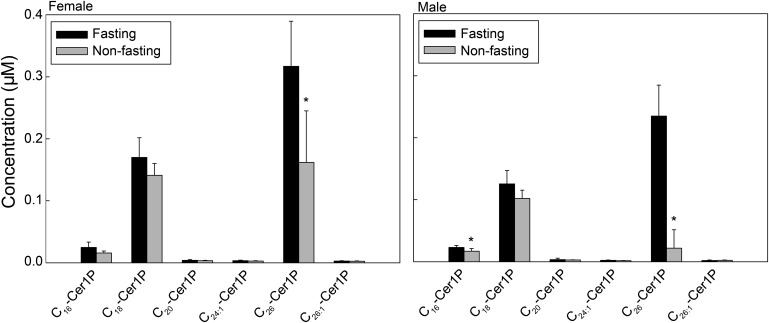
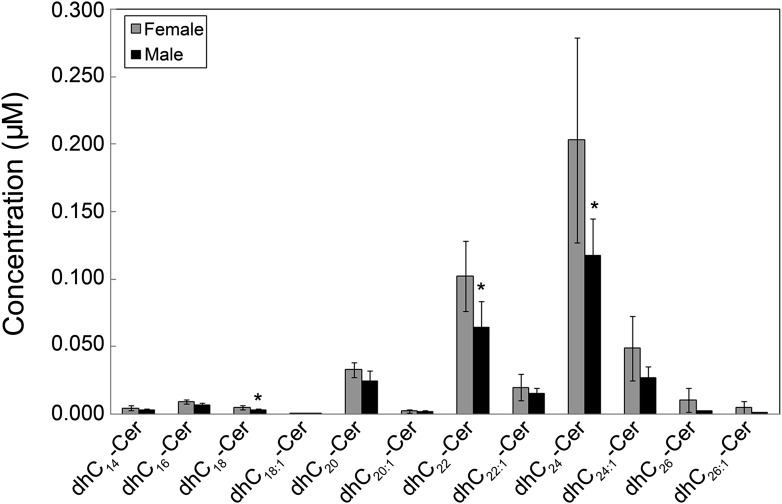
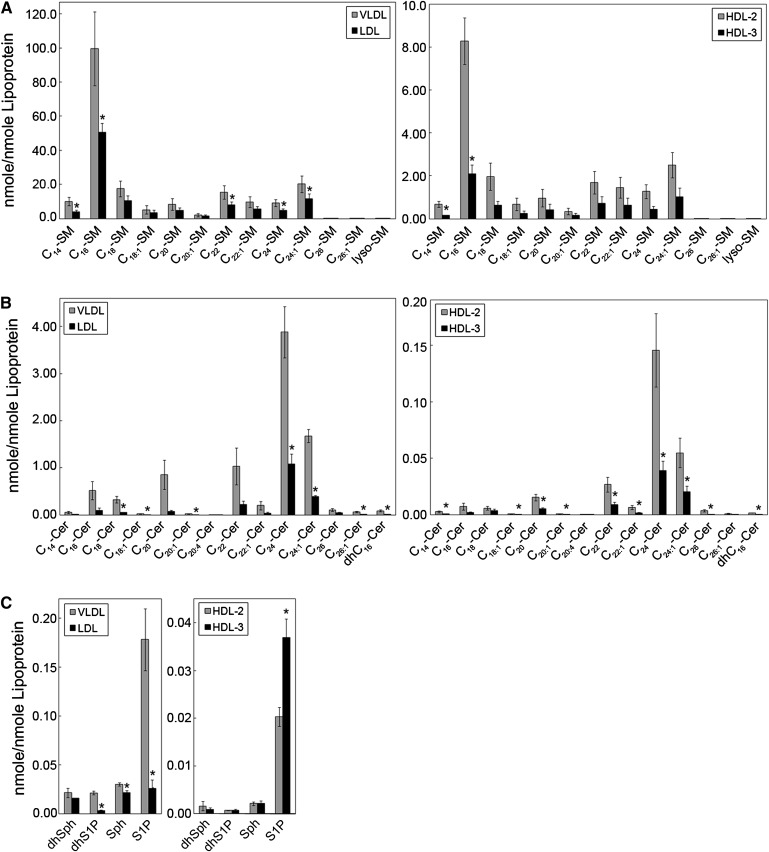
We used a HPLC-MS/MS methodology for determination of a basic metabolomic profile (18:1,18:0 sphingoid backbone, C(14)-C(26) N-acyl part) of "normal" sphingolipid levels in human serum and plasma. Blood was collected from healthy males and nonpregnant females under fasting and nonfasting conditions with and without anticoagulants. Sphingolipids analyzed included sphingoid bases, sphingosine and dihydrosphingosine, their 1-phosphates (S1P and dhS1P), molecular species (C(n)-) of ceramide (Cer), sphingomyelin (SM), hexosylceramide (HexCer), lactosylceramide (LacCer), and Cer 1-phosphate (Cer1P). SM, LacCer, HexCer, Cer, and Cer1P constituted 87.7, 5.8, 3.4, 2.8, and 0.15% of total sphingolipids, respectively. The abundant circulating SM was C(16)-SM (64.0 µM), and it increased with fasting (100 µM). The abundant LacCer was C(16)-LacCer (10.0 µM) and the abundant HexCer was C(24)-HexCer (2.5 µM). The abundant Cer, C(24)-Cer (4.0 µM), was not influenced by fasting; however, levels of C(16)-C(20) Cers were decreased in response to fasting. S1P levels were higher in serum than plasma (0.68 µM vs. 0.32 µM). We also determined levels of sphingoid bases and SM species in isolated lipoprotein classes. HDL(3) was the major carrier of S1P, dhS1P, and Sph, and LDL was the major carrier of Cer and dhSph. Per particle, VLDL contained the highest levels of SM, Cer, and S1P. HPLC-MS/MS should provide a tool for clinical testing of circulating bioactive sphingolipids in human blood.


Figures

Fig. 1.
Fig. 1.
SM is the dominant circulating sphingolipid. Each target analyte (SM species) was analyzed by reversed-phase HPLC-MS/MS and identified by its specific parent-daughter ion mass transition and retention time. Data are expressed as means ± SD, values for each serum sample are the average of duplicates extracted separately (100 µL each). Statistical differences detected between fasting and nonfasting groups are indicated with an asterisk (n = 5 for each group, P < 0.05).
Fig. 2.
Fig. 2.
C16-LacCer is the dominant molecular species of LacCer. Each target LacCer species was analyzed by reversed-phase HPLC-MS/MS and identified by its specific parent-daughter ion mass transition and retention time. Data are expressed as means ± SD, values for each plasma EDTA sample are the average of duplicates extracted separately (100 µL each). Statistical differences detected between fasting and nonfasting groups are indicated with an asterisk (n = 5 for each group, P < 0.05).
Fig. 3.
Fig. 3.
Heparin reveals higher variability in levels of molecular species of HexCer than other anticoagulants. Each target HexCer species was analyzed by reversed-phase HPLC-MS/MS and identified by its specific parent-daughter ion mass transition and retention time. Data are expressed as means ± SD, values for each male donor are the average of duplicates extracted separately (100 µL each). Statistical differences detected between fasting and nonfasting groups are indicated with an asterisk (n = 5 for each group, P < 0.05).
Fig. 4.
Fig. 4.
Levels of Cn-Cer are similar in plasma and serum and levels of S1P and dhS1P are higher in serum than plasma. Each target analyte (S1P and Cer species) was analyzed by reversed-phase HPLC-MS/MS and identified by its specific parent-daughter ion mass transition and retention time. Data are expressed as means ± SD. Values for each fasting donor are the average of duplicates extracted separately (100 µL each). Statistical differences detected between each plasma group and serum are indicated with an asterisk (n = 5 for each group, P < 0.05).
Fig. 5.
Fig. 5.
Levels of short- and medium-chain Cers but not C24-Cer decrease in response to fasting. Each target analyte (Sph, S1P, and Cer species) was analyzed by reversed-phase HPLC-MS/MS and identified by its specific parent-daughter ion mass transition and retention time. Data are expressed as means ± SD, values for each serum sample are the average of duplicates extracted separately (100 µL each). Statistical differences detected between fasting and nonfasting groups are indicated with an asterisk (n = 5 for each group, P < 0.05).
Fig. 6.
Fig. 6.
Levels of C26-Cer1P increase in response to fasting. Each target Cer1P species was analyzed by reversed-phase HPLC-MS/MS and identified by its specific parent-daughter ion mass transition and retention time. Data are expressed as means ± SD, values for each serum sample are the average of duplicates extracted separately (100 µL each). Statistical differences detected between fasting and nonfasting groups are indicated with an asterisk (n = 5 for each group, P < 0.05).
Fig. 7.
Fig. 7.
Levels of Cn-dhCer are higher in females than males. Each target dhCer species was analyzed by reversed-phase HPLC-MS/MS and identified by its specific parent-daughter ion mass transition and retention time. Data are expressed as means ± SD, values for each serum sample under fasting conditions are the average of duplicates extracted separately (100 µL each). Statistical differences detected between males and females are indicated with an asterisk (n = 5 for each group, P < 0.05).
Fig. 8.
Fig. 8.
Sphingolipid levels in lipoprotein particles. Blood was collected after 12 h of fasting from healthy normolipemic subjects and equal amount (100 µg) of VLDL, LDL, and HDL subclasses (HDL2 and HDL3) was extracted and analyzed using HPLC/MS/MS as described in “Methods.” A: Levels of molecular species of SM. B: Levels of molecular species of Cer. C: Levels of Sph, dhSph, S1P, and dhS1P. Levels of sphingolipid species were calculated per nmol lipoprotein as described in “Methods.” n = 3 pooled plasma samples, except for Cer, Sph, dhSph, S1P, and dhS1P in HDL2 and HDL3, n = 8 pooled plasma samples. Data are expressed as mean ± SE.

References

    1. Cuvillier O., Pirianov G., Kleuser B., Vanek P. G., Coso O. A., Gutkind S., Spiegel S. 1996. Suppression of ceramide-mediated programmed cell death by sphingosine-1-phosphate. Nature. 381: 800–803. - PubMed
    1. Hannun Y. A. 1996. Functions of ceramide in coordinating cellular responses to stress. Science. 274: 1855–1859. - PubMed
    1. Mathias S., Pena L. A., Kolesnick R. N. 1998. Signal transduction of stress via ceramide. Biochem. J. 335: 465–480. - PMC - PubMed
    1. Spiegel S., Merrill A. H., Jr 1996. Sphingolipid metabolism and cell growth regulation. FASEB J. 10: 1388–1397. - PubMed
    1. Vesper H., Schmelz E. M., Nikolova-Karakashian M. N., Dillehay D. L., Lynch D. V., Merrill A. H., Jr 1999. Sphingolipids in food and the emerging importance of sphingolipids to nutrition. J. Nutr. 129: 1239–1250. - PubMed

Publication types