Comment
. 2010 Aug 4;102(15):1148-59.
doi: 10.1093/jnci/djq257. Epub 2010 Jul 21.

GLI2-mediated melanoma invasion and metastasis

Affiliations
Comment

GLI2-mediated melanoma invasion and metastasis

Vasileia-Ismini Alexaki et al. J Natl Cancer Inst. .

Abstract

Background: The transforming growth factor-beta (TGF-beta) pathway, which has both tumor suppressor and pro-oncogenic activities, is often constitutively active in melanoma and is a marker of poor prognosis. Recently, we identified GLI2, a mediator of the hedgehog pathway, as a transcriptional target of TGF-beta signaling.

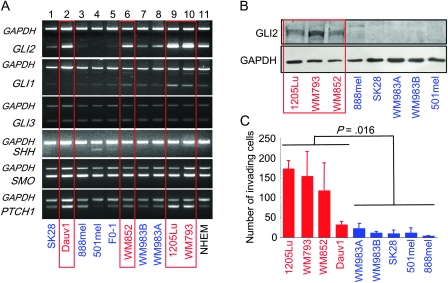
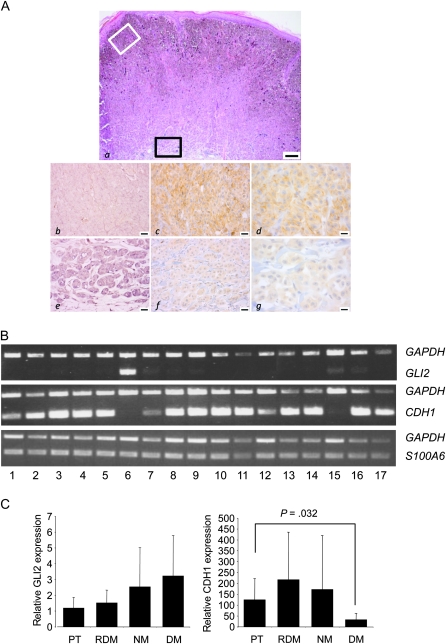
Methods: We used real-time reverse transcription-polymerase chain reaction (RT-PCR) and western blotting to determine GLI2 expression in human melanoma cell lines and subsequently classified them as GLI2high or as GLI2low according to their relative GLI2 mRNA and protein expression levels. GLI2 expression was reduced in a GLI2high cell line with lentiviral expression of short hairpin RNA targeting GLI2. We assessed the role of GLI2 in melanoma cell invasiveness in Matrigel assays. We measured secretion of matrix metalloproteinase (MMP)-2 and MMP-9 by gelatin zymography and expression of E-cadherin by western blotting and RT-PCR. The role of GLI2 in development of bone metastases was determined following intracardiac injection of melanoma cells in immunocompromised mice (n = 5-13). Human melanoma samples (n = 79) at various stages of disease progression were analyzed for GLI2 and E-cadherin expression by immunohistochemistry, in situ hybridization, or RT-PCR. All statistical tests were two-sided.

Results: Among melanoma cell lines, increased GLI2 expression was associated with loss of E-cadherin expression and with increased capacity to invade Matrigel and to form bone metastases in mice (mean osteolytic tumor area: GLI2high vs GLI2low, 2.81 vs 0.93 mm(2), difference = 1.88 mm(2), 95% confidence interval [CI] = 1.16 to 2.60, P < .001). Reduction of GLI2 expression in melanoma cells that had expressed high levels of GLI2 substantially inhibited both basal and TGF-beta-induced cell migration, invasion (mean number of Matrigel invading cells: shGLI2 vs shCtrl (control), 52.6 vs 100, difference = 47.4, 95% CI = 37.0 to 57.8, P = .024; for shGLI2 + TGF-beta vs shCtrl + TGF-beta, 31.0 vs 161.9, difference = -130.9, 95% CI = -96.2 to -165.5, P = .002), and MMP secretion in vitro and the development of experimental bone metastases in mice. Within human melanoma lesions, GLI2 expression was heterogeneous, associated with tumor regions in which E-cadherin was lost and increased in the most aggressive tumors.

Conclusion: GLI2 was directly involved in driving melanoma invasion and metastasis in this preclinical study.


Figures

Figure 1
Figure 1
Expression of Sonic Hedgehog (SHH) pathway components in a panel of human melanoma cell lines and relationship between GLI2 levels and Matrigel invasion. Cell lines expressing high levels of GLI2 (GLI2high) are shown in red, and cell lines expressing low levels of GLI2 (GLI2low) are shown in blue. A) Semiquantitative multiplex reverse transcription–polymerase chain reaction (RT-PCR). GLI1, GLI3, GLI2, SHH, Smoothened (SMO), and Patched1 (PTCH1) mRNA expression was measured in 10 human melanoma cell lines (lanes 1–10) and normal human epidermal melanocytes (NHEM, lane 11) in culture. Expression of the glyceraldehyde-3-phosphate dehydrogenase gene, GAPDH, was examined as a control in the same RT-PCR reaction as each gene of interest. B) Western blot analysis. GLI2 protein levels were determined in various melanoma cell lines using 100 μg protein per lane. Determination of GAPDH levels served as a loading control. C) Matrigel invasion assay. Melanoma cells (5 × 10⁴) were added to the upper well of each Matrigel invasion chamber in serum-free RPMI medium. The number of invading cells was counted 24 hours later using bright field microscopy at ×200 in six random fields. Experiments were performed four times using duplicate samples for each cell line. Statistical significance was calculated using the Mann–Whitney test. Error bars = 95% confidence intervals. GLI2high vs GLI2low groups: P = .016. All statistical tests were two-sided.
Figure 2
Figure 2
A role for GLI2 in melanoma cell migration and invasion. A) GLI2 silencing. GLI2 protein expression was silenced in 1205Lu human melanoma cells by infection with lentiviral particles carrying a short hairpin RNA (shRNA) against GLI2 (shGLI2). A nontargeting shRNA (shCtrl) was used as control. Relative GLI2 protein levels were measured by western blotting, and blots were reprobed with antibody to β-actin as an internal control. B) Matrix metalloproteinase (MMP)-2 and MMP-9 secretion by 1205Lu cells expressing shGLI2 or control shRNAs. Cells were cultivated 72 hours in serum-free medium in the absence or presence of 10 ng/mL transforming growth factor-β (TGF-β), conditioned medium was collected and subjected to electrophoresis, and MMP activity was visualized by gelatin zymography. The experiment was repeated three times, and a representative experiment is shown. C) Matrigel invasion assay. After stable transfection with control shRNA (shCtrl) or shGLI2, 1205Lu melanoma cells were incubated in the absence or presence of 10 ng/mL TGF-β. Then, 5 × 10⁴ cells were added to the upper well of each Matrigel invasion chamber in serum-free RPMI medium with or without 10 ng/mL TGF-β. The number of invading cells was counted 24 hours later using bright field microscopy at ×200 in six random fields. Results are expressed as the mean of two independent experiments, each performed in duplicate. D) Wound closure assays. Confluent monolayers of shCtrl and shGLI2 1205Lu melanoma cells were wounded by a scratch with a pipette tip. Culture medium was replaced with fresh medium containing mitomycin (4 μg/mL) to prevent cell proliferation. Wound closure was monitored by phase contrast microscopy. A representative photomicrograph at ×200 magnification for each condition is shown. Photos were taken immediately (0 hours) or 48 hours after wounding. Experiments were repeated three times with similar results. E) GLI-dependent transcription. SK28 human melanoma cells were stably transfected with either an expression vector carrying the gene for the constitutively active mutant, GLI2-ΔN2, or the empty vector (ctrl). GLI-dependent transcription was measured by transient transfection of these cells with the GLI reporter construct (GLI-BS)8-luc and measurement of the activity of the luciferase reporter. Results, expressed as relative luciferase activity, are the mean of two independent experiments, each performed with duplicate samples. F) Matrigel invasion assays of ctrl- and GLI2-ΔN2–transfected SK28 melanoma cells. The cells described in (E) were treated as described in (C). The number of invading cells was counted 24 hours later using bright field microscopy at ×200 in six random fields. Results are expressed as the mean of three independent experiments, each performed in duplicate. Statistical analysis was performed using the Mann–Whitney test. Error bars are 95% confidence intervals. All statistical tests were two-sided.
Figure 3
Figure 3
GLI2 expression in melanoma cells and incidence of bone metastasis in mice. A) Incidence of bone metastasis. Mice (n = 5–8) were inoculated by injection of the left cardiac ventricle with GLI2high melanoma cells (1205Lu and WM852) or GLI2low cell lines (SK28, 888Mel, and 501Mel). The development of bone metastases is shown by representative x-ray images of the hind limbs of the mice at 4 weeks after intracardiac inoculation. Arrows indicate osteolytic lesions. For each cell type, the percent incidence of bone metastases is shown. B) Mouse survival. Kaplan–Meier curves are shown for mice inoculated with various melanoma cell lines. Cells expressing high amounts of GLI2 (GLI2high) are shown in red, and cells expressing low amounts (GLI2low) are shown in blue. Blue squares: SK28, blue diamonds: 888mel, blue triangles: 501mel, red circles: WM852, red triangles: 1205Lu. The Mann–Whitney test was used to assess the difference in survival between groups. Mice inoculated with GLI2low cells survived longer than those with GLI2 cells (mean survival for all GLI2high cell lines [1205Lu + WM852] = 29.7 days, mean survival for all GLI2low cell lines [888mel + SK28 + 501mel] = 39.1 days, difference = 9.4 days, 95% confidence interval [CI] = 5.22 to 13.64, P < .001). The number of mice at risk (for those inoculated with 1205Lu or 888mel melanoma cells) at days 0 and 30 and the 95% confidence interval for survival at 4 weeks are also shown. C) Osteolytic lesion area following intracardiac inoculation of melanoma cells in mice. Blue squares: SK28, blue diamonds: 888mel, blue triangles: 501mel, red circles: WM852, red triangles: 1205Lu. Error bars are 95% confidence intervals. Two-way analysis of variance with Bonferroni posttests adjusted for multiple comparisons: 1205 vs SK28: P < .001; 1205Lu vs 888mel: P < .001; 1205Lu vs 501mel: P < .01; 1205Lu vs WM852: not significantly different (n.s.); WM852 vs SK28: P < .001; WM852 vs 888mel: P < .001; WM852 vs 501mel: P < .01; SK28 vs 888mel: n.s., SK28 vs 501mel: n.s., 888mel vs 501mel: n.s. All GLI2high (1205Lu + WM852) vs all GLI2low (SK28 + 888mel + 501mel): P < .001. Error bars reflect 95% confidence intervals. D) Effect of GLI2 silencing on the incidence of bone metastasis after intracardiac inoculation. Representative x-ray images of the hind limbs of mice (n = 12–13) bearing bone metastases 4 weeks after the inoculation of 1205Lu melanoma cells expressing either of two short hairpin RNAs (shRNAs) to GLI2 (shGLI2-1 and shGLI2-2) vs control shRNA (shCtrl) are shown. Arrows indicate osteolytic lesions, and for each cell type, the percent incidence of bone metastases is shown. E) Incidence of osteolytic metastases in mice (n = 12–13) following intracardiac injection of 1205Lu cells that expressed GLI2 or control shRNA. The area occupied by osteolytic lesions on radiographs was measured by computerized image analysis of radiographs of the forelimbs and hind limbs at 4 weeks postinoculation. The size of metastases from mice with the following is shown: black squares, cells with control shRNA (shCtrl); black triangles, shGLI2-1; open circles, shGLI2-2 (shCtrl vs shGLI2-1: P < .05; shCtrl vs shGLI2-2: P < .001). Error bars reflect 95% confidence intervals.
Figure 4
Figure 4
GLI2 expression and loss of E-cadherin in human melanoma cells. A) Expression of genes related to epithelial–mesenchymal transition. Total mRNA from four GLI2high human melanoma cell lines (red) and six GLI2low melanoma cell lines (blue) and from normal human epidermal melanocytes (NHEM cells) was analyzed by multiplex semiquantitative RT-PCR to determine GLI2, CDH1 (E-cadherin), CDH2 (N-cadherin), SNAIL, SLUG, TWIST, and SIP1 expression. Glyceraldehyde-3-phosphate dehydrogenase (GAPDH) gene expression was measured simultaneously in each PCR reaction as an internal control. Notable examples of the inverse relationship between GLI2 and CDH1 expression are highlighted in Dauv1, WM852, 1205Lu, and WM793 cell lines (green frames). B) Western blot analysis of E-cadherin protein levels in melanoma cell lines. E-cadherin was absent in GLI2high cell lines (red labels), whereas strong bands were detected in all GLI2low lines (blue labels). GLI2 protein levels in the same samples can be found in Figure 1, B.
Figure 5
Figure 5
GLI2 expression and loss of E-cadherin in human melanoma lesions. A) Variously stained sections of a representative primary cutaneous melanoma are shown. Panel (a) shows a hematoxylin and eosin–stained section of the tumor at low magnification (scale bar = 200 μm). Adjacent sections from the superficial (white box; panels bd) and deep dermal (black box; panels eg) layers were stained with either a riboprobe to detect GLI2 mRNA (panels b and e) or a monoclonal antibody to detect E-cadherin protein (panels c, d, f, and g) and are shown in more detail (scale bars for b, c, e, and f = 25 μm; for d and g = 12.5 μm). Additional photomicrographs of GLI2 and E-cadherin–stained primary melanoma tumor sections can be found in Supplementary Figure 1, available online. B) Semiquantitative multiplex reverse transcription–polymerase chain reaction (RT-PCR) to determine GLI2 and CDH1 (E-cadherin) expression levels in total RNA extracted from a panel of 17 frozen human melanoma lymph node metastases. Expression of the S100A6 calcium-binding protein and GAPDH (glyceraldehyde-3-phosphate dehydrogenase) genes was also determined as an internal control. Note the absence of CDH1 mRNA in samples strongly expressing GLI2. C) Real-time RT-PCR analysis of GLI2 (left panel) and CDH1 (right panel) expression in 42 frozen melanoma samples classified according to tumor stage. DM = distant metastasis; NM = nodal metastasis; PT = primary tumor; RDM = regional dermal metastasis. Values are the mean of 10 samples in each group (12 for the DM group), each of them measured in triplicate and standardized relative to cyclophilin A expression. Error bars reflect 95% confidence intervals. P value was determined using the Mann–Whitney test. All statistical tests were two-sided.

Comment in

Comment on

References

    1. Houghton AN, Polsky D. Focus on melanoma. Cancer Cell. 2002;2(4):275–278. - PubMed
    1. Bastian BC. Molecular genetics of melanocytic neoplasia: practical applications for diagnosis. Pathology. 2004;36(5):458–461. - PubMed
    1. Curtin JA, Fridlyand J, Kageshita T, et al. Distinct sets of genetic alterations in melanoma. N Engl J Med. 2005;353(20):2135–2147. - PubMed
    1. Crowson AN, Magro C, Miller A, Mihm MC., Jr. The molecular basis of melanomagenesis and the metastatic phenotype. Semin Oncol. 2007;34(6):476–490. - PubMed
    1. Smalley KS. A pivotal role for ERK in the oncogenic behaviour of malignant melanoma? Int J Cancer. 2003;104(5):527–532. - PubMed

Publication types

MeSH terms