. 2010 Sep 15;588(Pt 18):3567-92.
doi: 10.1113/jphysiol.2010.188508. Epub 2010 Jul 26.

Prolonged space flight-induced alterations in the structure and function of human skeletal muscle fibres

Affiliations

Prolonged space flight-induced alterations in the structure and function of human skeletal muscle fibres

R H Fitts et al. J Physiol. .

Abstract

The primary goal of this study was to determine the effects of prolonged space flight (180 days) on the structure and function of slow and fast fibres in human skeletal muscle. Biopsies were obtained from the gastrocnemius and soleus muscles of nine International Space Station crew members 45 days pre- and on landing day (R+0) post-flight. The main findings were that prolonged weightlessness produced substantial loss of fibre mass, force and power with the hierarchy of the effects being soleus type I > soleus type II > gastrocnemius type I > gastrocnemius type II. Structurally, the quantitatively most important adaptation was fibre atrophy, which averaged 20% in the soleus type I fibres (98 to 79 μm diameter). Atrophy was the main contributor to the loss of peak force (P(0)), which for the soleus type I fibre declined 35% from 0.86 to 0.56 mN. The percentage decrease in fibre diameter was correlated with the initial pre-flight fibre size (r = 0.87), inversely with the amount of treadmill running (r = 0.68), and was associated with an increase in thin filament density (r = 0.92). The latter correlated with reduced maximal velocity (V(0)) (r = 0.51), and is likely to have contributed to the 21 and 18% decline in V(0) in the soleus and gastrocnemius type I fibres. Peak power was depressed in all fibre types with the greatest loss (55%) in the soleus. An obvious conclusion is that the exercise countermeasures employed were incapable of providing the high intensity needed to adequately protect fibre and muscle mass, and that the crew's ability to perform strenuous exercise might be seriously compromised. Our results highlight the need to study new exercise programmes on the ISS that employ high resistance and contractions over a wide range of motion to mimic the range occurring in Earth's 1 g environment.


Figures
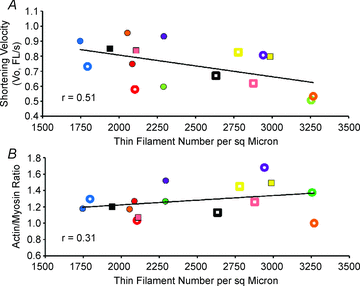
Figure 14
Figure 14. Correlations of fibre V0 and actin content with thin filament density
In pre- and post-flight soleus muscles, the shortening velocity (V0) of type I fibres is low when thin filament density is high and the correlation is significant at P < 0.05 (A), while the actin/myosin ratio of type I fibres did not change pre- to post-flight and the correlation with thin filament density was not significant (B). Each subject is colour coded as shown in Fig. 1 with the filled symbols pre-flight and the partially filled post-flight.
Figure 16
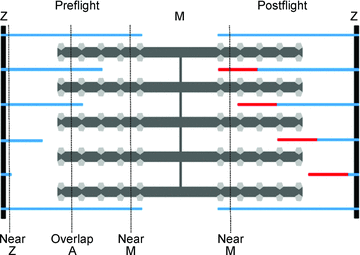
Figure 16. Conceptual diagram of increasing thin filament density following prolonged spaceflight
The sarcomere at 2.5 μm illustrates thin filament (blue line) density and lengths in a pre-flight muscle (left half) and post-flight density and lengths in the right half. Thin filaments arise from nucleation sites in the Z band and exhibit different lengths in normal skeletal muscles. The density of thin filaments is highest near the Z band (6 filaments in the Near Z region) and progressively decreases away from the Z band because some filaments are too short to overlap the A band (4 in Overlap A) and others end before reaching the Near M band region. After prolonged spaceflight, thin filament length increases (indicated by red extensions of thin filaments) and density increases in the Near M region (post-flight).
Figure 1
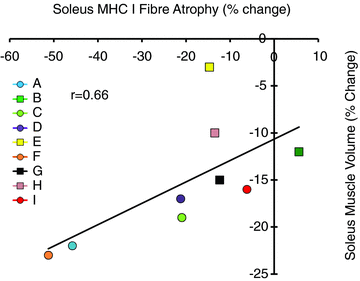
Figure 1. Relationship between soleus fibre atrophy and the decline in whole muscle volume with prolonged space flight
The percentage change (pre- to post-flight) in the mean type I fibre diameter is plotted versus the percentage change in soleus muscle volume for each crew member. The crew members A–I are identified by a specific colour with the low and high treadmill users indicated by circles and squares, respectively. The variables showed a significant (P < 0.05) correlation with an r = 0.66.
Figure 2
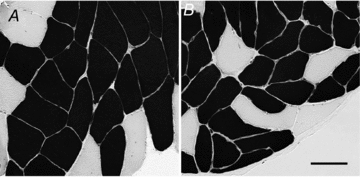
Figure 2. Representative pre- and post-flight fibre bundle
Cryostat cross sections of subject C pre-flight (A) and post-flight (B) soleus muscle fibres were stained histochemically for actomyosin ATPase activity after acid preincubation (method of Huckstorf et al. 2000). Slow fibres are darkly reactive, and fast fibres are lightly reactive. Based on computerized digitizing planimetry, the post-flight slow fibres are 31.5% smaller in cross-sectional area. Bar equals 75 μm for both panels.
Figure 3
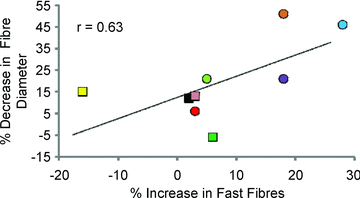
Figure 3. Relationship between microgravity induced fibre atrophy and percentage increase in fast fibres in slow soleus muscle
Symbols plot the percentage decrease in mean fibre diameter versus the percentage increase in fast fibre type for each crew member. Each subject A–I is colour coded as in Fig. 1.
Figure 4
Figure 4. Relationship between fibre diameter (μm) and peak Ca2+ activated isometric force (mN) pre- and post-flight for low treadmill group
Each symbol represents the result of a single soleus fibre. Type I fibres, blue diamonds. Type II fibres, red squares. Hybrid Type I/II fibres, green triangles. Number of fibres for each fibre type and crew member are shown.
Figure 5
Figure 5. Relationship between fibre diameter (μm) and peak Ca2+ activated isometric force (mN) pre- and post-flight for high treadmill group
Each symbol represents the result of a single soleus fibre. Type I fibres, blue diamonds. Type II fibres, red squares. Hybrid Type I/II fibres, green triangles. Number of fibres for each fibre type and crew member are shown.
Figure 6
Figure 6. Correlation of soleus type I fibre atrophy with treadmill running and pre-flight fibre diameter
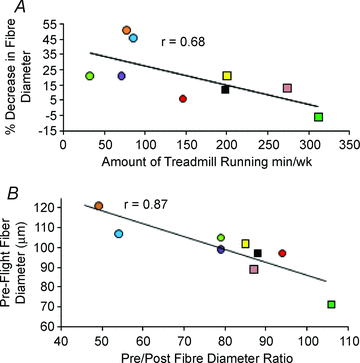
A, relationship between microgravity-induced fibre atrophy and amount of treadmill running (min week−1). Symbols plot the percentage decrease in mean fibre diameter versus amount of treadmill running (min week−1) for each crew member. B, relationship between pre-flight fibre diameter (μm) and percentage fibre atrophy. Symbols plot the mean pre-flight fibre diameter versus percentage fibre atrophy. For both the top and bottom plots, each subject is colour coded as shown in Fig. 1. The circles and squares indicate low and high treadmill groups, respectively.
Figure 7
Figure 7. Relationship between fibre diameter (μm) and peak Ca2+ activated isometric force (mN) pre- and post-flight for type II fibres
Each subject is colour coded as shown in Fig. 1. The average pre- and post-flight values are represented by circles and triangles, respectively. The plots show soleus type II fibres for the low (top left) and high (top right) treadmill groups, and gastrocnemius type II fibres from the low (bottom left) and high (bottom right) treadmill groups.
Figure 8
Figure 8. Force–power relationship of pre- and post-flight fibres
Continuous lines represent composite pre-flight force–power relationships and dashed lines the post-flight composite force–power relationship for soleus type I fibres (upper left), soleus type II fibres (upper right), gastrocnemius type I fibres (lower left), and gastrocnemius type II fibres (lower right).
Figure 9
Figure 9. SDS-polyacrylamide gels illustrating MHC, actin, MLC, troponin and tropomyosin in single human soleus fibres
The 12% gel illustrates the protein profile of two pre-flight and two post-flight fibres from crew member F. The fibre type, maximal shortening velocity determined by the slack test (V0), and the slope of the force–calcium relationship for forces <50% of maximal Ca2+-activated force (n2) are shown below each lane. The area outlined by the dotted box in panel A is expanded in panel B to show the troponin T fast fibre isozymes (TnT-f) and the tropomyosin isoforms Tm-β and Tm-α. The latter has a different mobility in fast compared to slow fibres. MHC, myosin heavy chain; MLC, myosin light chain; TnI, troponin I; S-TnC, fast skeletal fibre troponin C; C-TnC, cardiac/slow skeletal troponin C. Slow and fast isoforms of proteins are indicated by subscripted s and f, respectively.
Figure 10
Figure 10. Soleus myofibrillar ultrastructure
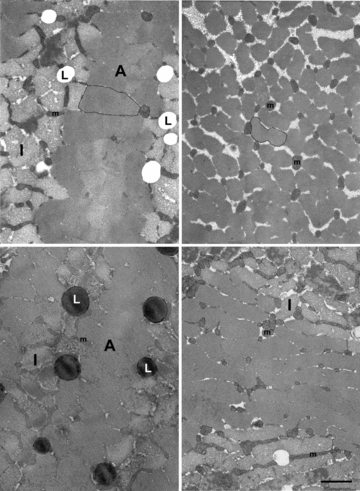
Cross sections of myofibrils cut through the A bands (A) and the thin filament rich I bands (I) in slow fibres of soleus muscle biopsied before and after a 6 month spaceflight from subject F (upper left – pre, upper right – post) averaging 51% atrophy and subject E (lower left – pre, lower right – post) showing moderate atrophy (15%). Myofibrils are outline by dotted lines in the A bands to illustrate decreased size post-flight (upper panels). Myofibrils are not marked in the lower panels because they have indistinct borders typical of slow fibres and are of similar size pre- and post-flight. The filamentous mitochondria (m) predominately encircling I bands in pre-flight muscle fibres become more globular post-flight and invade the A bands, most striking with greater atrophy (upper right). Both subjects contain abundant intracellular lipid droplets (L) pre-flight. Calibration bar, 1.6 μm for all panels.
Figure 11
Figure 11. Soleus thick and thin filament ultrastructure
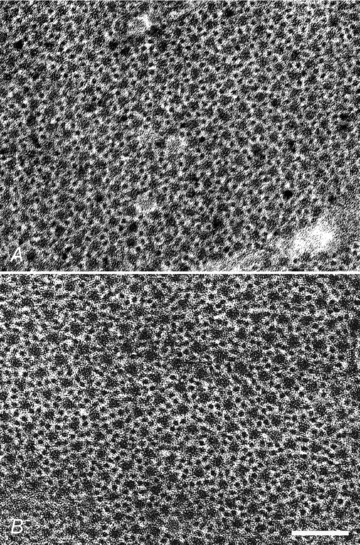
The pre-flight (A) and post-flight (B) electron microscopic images are cross sections through the A bands in regions showing thick and thin filament overlap in soleus slow fibres from subject F. The near M line region morphometrically sampled is in the centre of each micrograph. The post-flight increase (52%) in thin filament density is readily apparent. Scale bar, 100 nm.
Figure 12
Figure 12. Soleus fibre thin filament density
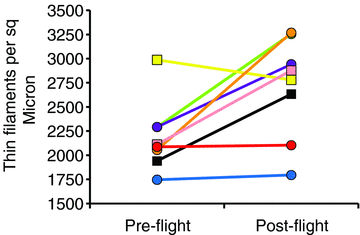
Thin filament density increased post-flight in 5 of 8 crew members and exhibited little change in 3 of 8 crew members. Subjects are colour coded as in Fig. 1. The circles are low treadmill users, and the squares are high treadmill users.
Figure 13
Figure 13. Relationship between soleus fibre atrophy and thin filament density
The post-flight increase in thin filament density correlates exponentially (P < 0.01) with increasing fibre atrophy. Thin filament density plateaus indicating attainment of the maximum number of thin filaments at ∼3200 μm−2. Markers are colour coded as in Fig. 1.
Figure 15
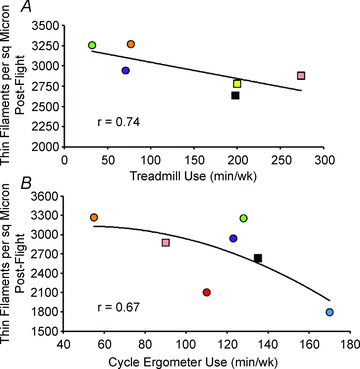
Figure 15. Correlation between thin filament density and the amount of treadmill (A) and cycle ergometer (B) exercise
Thin filament density is inversely related (P < 0.05) to the amount of treadmill (A) and cycle ergometer (B) use indicating that high treadmill or cycle ergometer use partially counters the increase in thin filament density. The markers are colour coded for crew member as in Fig. 1.

Comment in

  • Wasting away in Mars-Aritaville.
    Joyner MJ. Joyner MJ. J Physiol. 2010 Nov 1;588(Pt 21):4071. doi: 10.1113/jphysiol.2010.198861. J Physiol. 2010. PMID: 21037316 Free PMC article. No abstract available.

References

    1. Antonutto G, Capelli C, Girardis M, Zamparo P, di Prampero PE. Effects of microgravity on maximal power of lower limbs during very short efforts in humans. J Appl Physiol. 1999;86:85–92. - PubMed
    1. Bergstrom J. Muscle electrolytes in man. Scand J Clin Lab Invest. 1962;14(Suppl 68):7–110. - PubMed
    1. Brenner B. Rapid dissociation and reassociation of actomyosin cross-bridges during force generation: A newly observed facet of cross-bridge action in muscle. Proc Natl Acad Sci U S A. 1991;88:10490–10494. - PMC - PubMed
    1. Burkholder TJ, Lieber RL. Sarcomere length operating range of vertebrate muscles during movement. J Exp Biol. 2001;204:1529–1536. - PubMed
    1. Castillo A, Nowak R, Littlefield KP, Fowler VM, Littlefield RS. A nebulin ruler does not dictate thin filament lengths. Biophys J. 2009;96:1856–1865. - PMC - PubMed

Publication types

LinkOut - more resources