. 2010 Aug 2;207(8):1727-43.
doi: 10.1084/jem.20100276. Epub 2010 Jul 26.

Anaplasma phagocytophilum induces actin phosphorylation to selectively regulate gene transcription in Ixodes scapularis ticks

Affiliations

Anaplasma phagocytophilum induces actin phosphorylation to selectively regulate gene transcription in Ixodes scapularis ticks

Hameeda Sultana et al. J Exp Med. .

Erratum in

  • J Exp Med. 2011 Aug 1;208(8):1737

Abstract

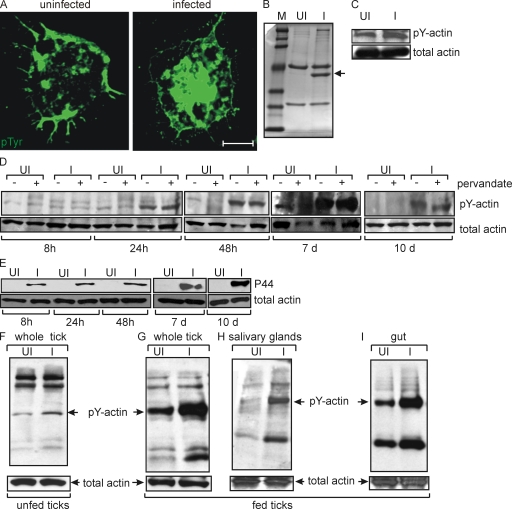
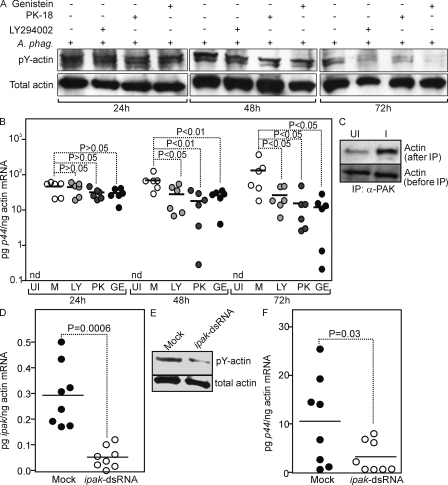
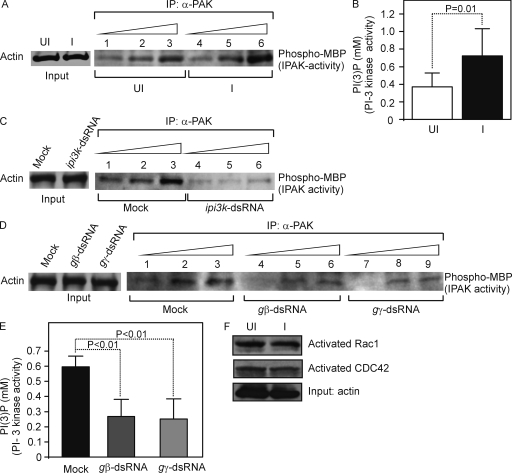
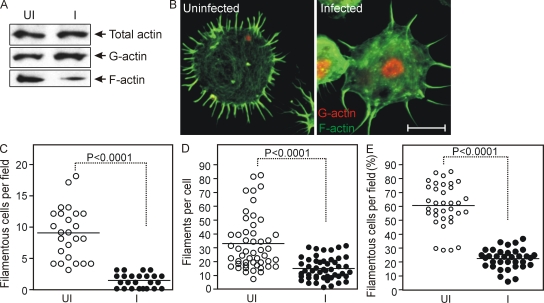
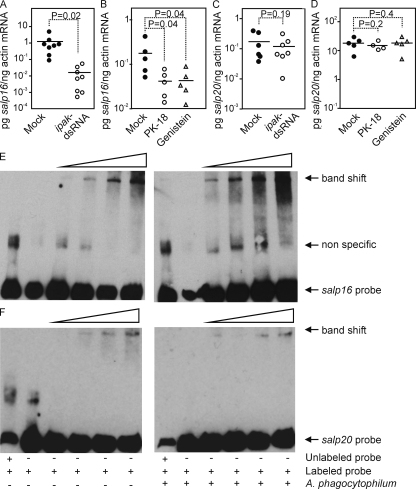
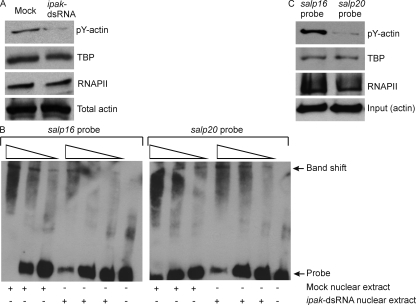
Anaplasma phagocytophilum, the agent of human anaplasmosis, persists in ticks and mammals. We show that A. phagocytophilum induces the phosphorylation of actin in an Ixodes ricinus tick cell line and Ixodes scapularis ticks, to alter the ratio of monomeric/filamentous (G/F) actin. A. phagocytophilum-induced actin phosphorylation was dependent on Ixodes p21-activated kinase (IPAK1)-mediated signaling. A. phagocytophilum stimulated IPAK1 activity via the G protein-coupled receptor Gbetagamma subunits, which mediated phosphoinositide 3-kinase (PI3K) activation. Disruption of Ixodes gbetagamma, pi3k, and pak1 reduced actin phosphorylation and bacterial acquisition by ticks. A. phagocytophilum-induced actin phosphorylation resulted in increased nuclear G actin and phosphorylated actin. The latter, in association with RNA polymerase II (RNAPII), enhanced binding of TATA box-binding protein to RNAPII and selectively promoted expression of salp16, a gene crucial for A. phagocytophilum survival. These data define a mechanism that A. phagocytophilum uses to selectively alter arthropod gene expression for its benefit and suggest new strategies to interfere with the life cycle of this intracellular pathogen, and perhaps other Rickettsia-related microbes of medical importance.


Figures

Figure 1.
Figure 1.
A. phagocytophilum induces actin phosphorylation in tick cells and ticks. (A) Immunofluorescence images of uninfected and A. phagocytophilum–infected tick cells at 48 h after infection, stained for phosphotyrosine (pTyr). Bar, 10 µm. Representative images are shown from three independent experiments. (B) Coomassie-stained SDS-PAGE image of anti-pTyr immunoprecipitated proteins from uninfected (UI) and A. phagocytophilum-infected (I) lysates at 48 h after infection. The arrow denotes the dominant phosphorylated band identified as actin in A. phagocytophilum–infected cells. Phosphorylation of a protein with a higher molecular mass was also noted. (C) Lysates with (I) or without (UI) A. phagocytophilum were immunoprecipitated with antibodies against pTyr and probed with antibodies against actin. The level of actin before immunoprecipitation (total actin) served as the loading control. (D) Lysates from cells infected (I) or not (UI) with A. phagocytophilum were isolated at different time points (8, 24, and 48 h and 7 and 10 d) and assessed for actin phosphorylation in the presence (+) or absence (−) of pervanadate, a protein tyrosine phosphatase inhibitor. (E) The presence of A. phagocytophilum in infected tick cells was assessed by immunoblotting with antisera specific for the A. phagocytophilum P44 antigen (P44). Actin served as loading control. (F) Lysates were prepared from unfed ticks infected (I) or not (UI) with A. phagocytophilum. 20 µg of total lysates were probed with pTyr-specific antibody. pY-actin is denoted by an arrow. Total actin served as loading control. Whole tick (G), salivary gland (H), and gut tissue (I) lysates were prepared from I. scapularis fed for 48 h on uninfected or A. phagocytophilum–infected mice and were analyzed as described in F. Representative data are shown from three independent experiments in all panels.
Figure 2.
Figure 2.
Ixodes PI3K, PAK1, or tyrosine kinases affect A. phagocytophilum–induced actin phosphorylation and bacterial loads in tick cells. (A) Tick cells treated with PI3K (LY294002), PAK1 (PK-18), or tyrosine kinase (Genistein) inhibitors were infected with A. phagocytophilum (A. phag.) and assessed for actin phosphorylation at 24, 48, and 72 h. Phosphorylated (pY-actin) and total actin (loading control) were analyzed by probing with pTyr-specific and actin-specific antibodies, respectively. Mock samples were treated with equal amounts of DMSO. Representative data from two independent experiments is shown. (B) A. phagocytophilum burden in tick cells was measured by quantifying p44 mRNA levels normalized against tick β actin mRNA. UI, uninfected; M, mock; LY, PI3K-inhibitor; PK, PAK1-inhibitor; GE, Genistein; nd, nondetectable. Each circle represents one independent experiment. (C) Whole infected (I) or uninfected (UI) tick cell extracts were immunoprecipitated (IP) with PAK1-specific antibody and immunoblotted for actin. Total cell lysates (before immunoprecipitation) probed with actin-specific antibody served as the loading control. (D) Q-RT-PCR showing reduced ipak1 mRNA levels in ipak1-dsRNA–injected ticks compared with the mock controls (buffer alone). Each circle represents one tick. (E) Phosphorylated (pY-actin) and total actin levels (loading control) from tick lysates were analyzed by immunoblotting with pTyr-specific and actin-specific antibodies, respectively. (F) The A. phagocytophilum burden in ticks was measured by quantifying p44 mRNA levels normalized against tick β actin mRNA. Each circle represents an individual tick. Statistics were performed using the Student’s t test and the p-value is shown. Representative data from three independent experiments is shown. Horizontal bars in B, D, and F indicate mean values of the data points.
Figure 3.
Figure 3.
A. phagocytophilum infection induces IPAK1 and IPI3K activity through Gβγ stimulation but independent of Rac1/Cdc42 activation. (A) Lysates from ticks infected (I) or not (UI) with A. phagocytophilum were immunoprecipitated (IP) with anti-PAK1, and PAK1-mediated phosphorylation of the substrate MBP was analyzed by in vitro kinase assay. Total lysates used for the kinase assay were probed with actin antibody as the loading control (input). (B) IPI3K activity read out by ELISA detecting PI conversion to PI(3)P, IPI-3 immunoprecipitates from lysates of A. phagocytophilum–infected or uninfected ticks. (C and D) IPAK1 activity in ipi3k-silenced ticks (C) or igβ- or igγ-silenced ticks (D) in comparison with their respective mock controls was measured as in A. Total lysates used for the kinase assays were probed with actin antibody as the loading control. In A, C, and D, IPAK immunoprecipitates were used at three different dilutions indicated by wedges (10, 15, and 25 µl IP beads). (E) IPI3K activity in igβ- or igγ-silenced ticks in comparison with the mock control was determined as in B. (F) Rac1/Cdc42 activation upon binding to PAK-PBD (Rac1/CDC42 binding domain of PAK1) upon A. phagocytophilum infection. Total tick lysates were used for affinity precipitation of Rac1/Cdc42 GTPases with PAK-PBD beads. Total lysates before precipitation were probed with actin as the loading control. Statistics were performed using the Student’s t test, and the p-value is shown in B and E. Error bars show mean + SD. Representative data from two independent experiments is shown in all panels.
Figure 4.
Figure 4.
A. phagocytophilum infection alters the G/F-actin ratio in tick cells. (A) Immunoblots of F-actin and G-actin in A. phagocytophilum–infected tick cells (I) in comparison with the uninfected controls (UI). Total lysate used for separation of G/F actin (supernatant/pellet) ratio was probed with anti-actin as the loading control. (B) Immunofluorescence images of uninfected and A. phagocytophilum–infected tick cells stained for F-actin (green) and G-actin (red). Bar, 10 µm. (C) Quantification of the number of filamentous cells per microscopic field, using 25 random fields, is shown. (D) The number of filaments per cell, examining 50 cells in each group, is shown. (E) The percentage of cells positive for F-actin filaments was quantified from 35 random microscopic fields. Statistics were performed using the Student’s t test and the p-value is shown. Three independent experiments yielded similar results.
Figure 5.
Figure 5.
A. phagocytophilum–induced phosphorylated/G-actin accumulates in tick cell nuclei. (A) Nuclear extracts were prepared from uninfected (UI) and A. phagocytophilum–infected (I) cells and subjected to immunoprecipitation (IP) and immunoblot (IB) with the indicated antibodies. Immunoblots for RNAPII and TBP served as loading control. Three independent experiments yielded similar results. (B) Confocal microscopy showing G-actin (red) and F-actin (green) in A. phagocytophilum–infected (I) or uninfected (UI) tick cells. Bar, 10 µM. (C and D) Uninfected and infected tick cells were stained with DNase I for G-actin (red; C) or anti-phosphotyrosine (red; D) and anti RNAPII (green) and TOPRO-3 (blue). Representative images from three independent experiments are shown. Bars, 20 µm.
Figure 6.
Figure 6.
A. phagocytophilum–induced actin phosphorylation selectively regulates I. scapularis salp16 gene expression. Q-RT-PCR results showing the levels of salp16 or salp20 in ipak1-dsRNA– (A and C), PK-18– (PAK1 inhibitor), or Genistein (tyrosine kinase inhibitor)-injected ticks, respectively (B and D). Mock controls were injected with buffer alone (A and C) or DMSO (B and D), respectively. The levels of salp16 or salp20 transcripts were quantified against tick β-actin transcripts. Each circle represents an individual tick. Statistics were performed using a Student’s t test and the p-value is shown. Horizontal bars in A–D indicate mean values of the data points. (E and F) EMSAs performed with the biotin-labeled salp16 (E) or salp20 (F) promoter TATA-binding regions and uninfected or A. phagocytophilum–infected nuclear extract proteins. Shifts and the salp16- or salp20-free probes are indicated with arrows. Representative gel images from three independent experiments are shown. Wedges indicate increasing amounts of nuclear extracts (1, 1.5, 2, and 2.5 µg).
Figure 7.
Figure 7.
Silencing or Inhibition of ipak1 does not alter salp15, salp17, salp25D, β-tubulin, or gapdh gene expression. Q-RT-PCR showing levels of salp15 (A and B), salp17 (C and D), salp25D (E and F), β-tubulin (G and H), and gapdh (I and J) mRNA in mock and ipak1-dsRNA–injected ticks (A, C, E, G, and I) and in mock or PK-18– (PAK1 inhibitor) or Genistein (tyrosine kinase inhibitor)–injected ticks (B, D, F, H, and J). Mock controls were injected with buffer alone (A, C, E, G, and I) or DMSO (B, D, F, H, and J), respectively. The levels of transcripts were quantified against tick β-actin transcripts. Each circle represents an individual tick. Statistics were performed using the Student’s t test, and the p-value is shown. Horizontal bars in all panels represent mean values of the data points.
Figure 8.
Figure 8.
A. phagocytophilum–induced actin phosphorylation selectively mediates I. scapularis salp16 gene promoter specificity. (A) Immunoblots showing the levels of phosphorylated actin, TBP, and RNAPII in A. phagocytophilum–infected mock (buffer alone) or ipak1-silenced tick nuclear extracts. Total actin served as the loading control. (B) EMSAs performed with the biotin-labeled salp16 or salp20 promoter TATA-binding regions and A. phagocytophilum–infected mock or ipak1-silenced nuclear extract proteins. Band shifts, salp16-, or salp20-free probes are indicated with arrows. Wedges indicate decreasing amounts of nuclear extracts (3, 2, and 1 µg). (C) Biotinylated DNAP with salp16 or salp20 probes and A. phagocytophilum–infected nuclear extract proteins. DNA precipitates were probed with actin-pTyr, anti-TBP, or anti-RNAP. Nuclear extracts were probed with anti-actin (input) as a loading control. Representative gel images from three independent experiments are shown in all panels.

References

    1. Bakken J.S., Dumler S.. 2008. Human granulocytic anaplasmosis. Infect. Dis. Clin. North Am. 22:433–448. 10.1016/j.idc.2008.03.011 - DOI - PubMed
    1. Bell-Sakyi L., Zweygarth E., Blouin E.F., Gould E.A., Jongejan F.. 2007. Tick cell lines: tools for tick and tick-borne disease research. Trends Parasitol 23:450–457. - PubMed
    1. Bettinger B.T., Gilbert D.M., Amberg D.C.. 2004. Actin up in the nucleus. Nat. Rev. Mol. Cell Biol. 5:410–415. 10.1038/nrm1370 - DOI - PubMed
    1. Bhavsar A.P., Guttman J.A., Finlay B.B.. 2007. Manipulation of host-cell pathways by bacterial pathogens. Nature. 449:827–834. 10.1038/nature06247 - DOI - PubMed
    1. Cameron L.A., Giardini P.A., Soo F.S., Theriot J.A.. 2000. Secrets of actin-based motility revealed by a bacterial pathogen. Nat. Rev. Mol. Cell Biol. 1:110–119. 10.1038/35040061 - DOI - PubMed

Publication types

MeSH terms