. 2010 Aug;136(2):203-24.
doi: 10.1085/jgp.201010450.

Modification of hERG1 channel gating by Cd2+

Affiliations

Modification of hERG1 channel gating by Cd2+

Jennifer Abbruzzese et al. J Gen Physiol. 2010 Aug.

Abstract

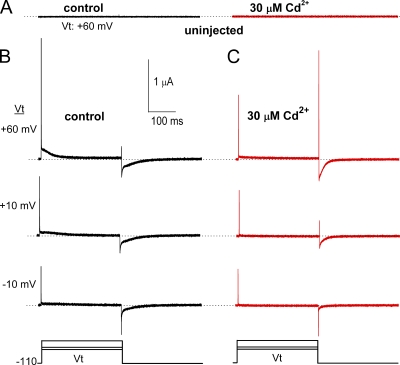
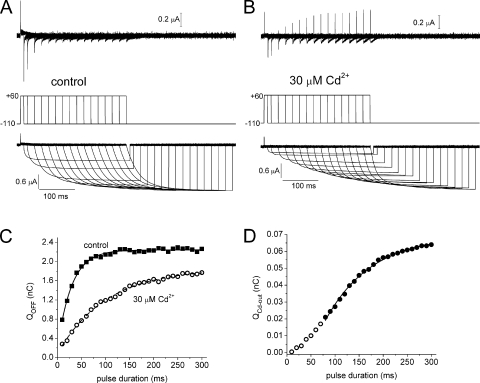
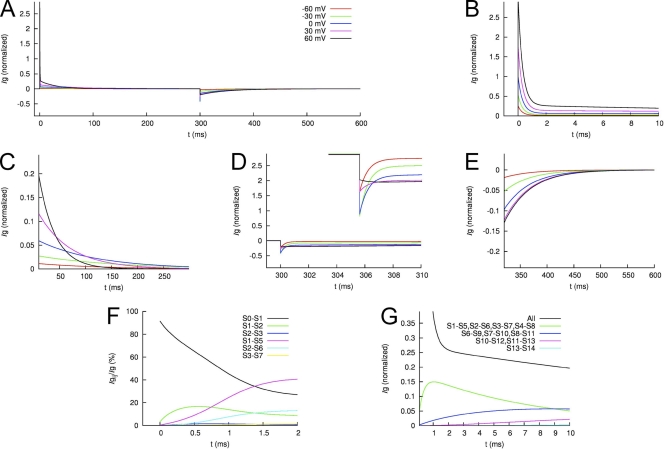
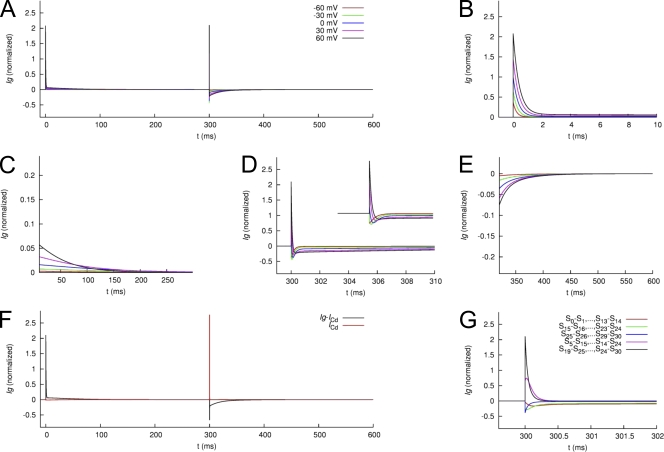
Each of the four subunits in a voltage-gated potassium channel has a voltage sensor domain (VSD) that is formed by four transmembrane helical segments (S1-S4). In response to changes in membrane potential, intramembrane displacement of basic residues in S4 produces a gating current. As S4 moves through the membrane, its basic residues also form sequential electrostatic interactions with acidic residues in immobile regions of the S2 and S3 segments. Transition metal cations interact with these same acidic residues and modify channel gating. In human ether-á-go-go-related gene type 1 (hERG1) channels, Cd(2+) coordinated by D456 and D460 in S2 and D509 in S3 induces a positive shift in the voltage dependence of activation of ionic currents. Here, we characterize the effects of Cd(2+) on hERG1 gating currents in Xenopus oocytes using the cut-open Vaseline gap technique. Cd(2+) shifted the half-point (V(1/2)) for the voltage dependence of the OFF gating charge-voltage (Q(OFF)-V) relationship with an EC(50) of 171 microM; at 0.3 mM, V(1/2) was shifted by +50 mV. Cd(2+) also induced an as of yet unrecognized small outward current (I(Cd-out)) upon repolarization in a concentration- and voltage-dependent manner. We propose that Cd(2+) and Arg residues in the S4 segment compete for interaction with acidic residues in S2 and S3 segments, and that the initial inward movement of S4 associated with membrane repolarization displaces Cd(2+) in an outward direction to produce I(Cd-out). Co(2+), Zn(2+), and La(3+) at concentrations that caused approximately +35-mV shifts in the Q(OFF)-V relationship did not induce a current similar to I(Cd-out), suggesting that the binding site for these cations or their competition with basic residues in S4 differs from Cd(2+). New Markov models of hERG1 channels were developed that describe gating currents as a noncooperative two-phase process of the VSD and can account for changes in these currents caused by extracellular Cd(2+).


Figures

Figure 1.
Figure 1.
Effect of Cd2+ on hERG1 channel gating currents. (A) Currents recorded at a Vt of +60 mV using the COVG technique from an uninjected oocyte before (control) and 10 min after bath application of 30 µM Cd2+. Recordings were made with the same solutions used to record gating currents in oocytes expressing hERG1 channels. (B and C) Gating currents recorded at the indicated Vt before and after treatment of the same oocyte with 30 µM Cd2+. Bottom panels illustrate voltage clamp protocol used to elicit gating currents shown in panels A–C.
Figure 2.
Figure 2.
Extracellular Cd2+ shifts the Q-V relationship for hERG1 to more positive potentials. (A) Normalized QOFF is plotted as a function of Vt and [Cd2+]e. Averaged data for control and each [Cd2+]e were fitted to a Boltzmann function (smooth curves). (B) Plot of change in V1/2 for Q-V and G-V relationships as a function of [Cd2+]e. Data were fitted to a Hill equation to determine EC50 and Hill coefficient (nH). ΔV1/2max was set at +90 mV (Fernandez et al., 2005). For Q-V relationship, EC50 = 171 ± 13 µM; nH = 0.53 ± 0.03. For G-V relationship, EC50 = 416 ± 20 µM; nH = 0.57 ± 0.02. The number of oocytes used to calculate the average data is indicated next to each data point. (C) [Cd2+]e-dependent effects on V1/2 for Q-V relationship. (D) [Cd2+]e-dependent effects on effective valence, z, of Boltzmann function for Q-V relationship. For A, C, and D, the number of oocytes was as follows: control, 20; 3 µM Cd2+ , 8; 10 µM Cd2+, 7; 30 µM Cd2+, 12; 100 µM Cd2+, 10; 300 µM Cd2+, 14.
Figure 3.
Figure 3.
Cd2+ reduces the fast and slow components of IgON and induces the appearance of ICd-out, a brief initial outward component that precedes IgOFF. (A) Superimposed traces for gating currents measured before and after treatment of an oocyte with 30 µM Cd2+. Top panel shows pulse protocol. (B) IgON shown on an expanded time scale. (C) IgOFF shown on an expanded time scale.
Figure 4.
Figure 4.
Gating currents measured without using p/−8 leak and capacitance current subtraction. (A) Unsubtracted currents recorded under control ionic conditions using pulse protocol illustrated in top panel. (B) Unsubtracted currents for the same oocyte in the presence of 30 µM Cd2+. (C) QOFF-V relationships for gating currents recorded in the absence and presence of 30 µM Cd2+. Data were fitted to a Boltzmann function (smooth curves). In control conditions, V1/2 = −22.1 mV and z = 2.29. In the presence of Cd2+, V1/2 = +7.8 mV and z = 1.52. (D) Superimposed traces of unsubtracted IgOFF for control (black traces) and 30 µM Cd2+ (red traces) at −110 mV after activating pulses were applied to the indicated Vt. (E) Superimposed traces for p/−8 subtracted (blue) and unsubtracted currents (red) in the presence of 30 µM Cd2+ for a Vt of +60 mV. Note that ICd-out is approximately the same, indicating that it is not an artifact of the on-line leak subtraction protocol.
Figure 5.
Figure 5.
Effect of [Cd2+]e on the magnitude of ICd-out. (A) IgOFF in the presence of 30 µM Cd2+. Arrows indicate zero current level. Gray bar indicates region of IgOFF integrated to obtain total QOFF. (B) ICd-out shown in A, plotted on an expanded time scale. Gray bar indicates the region of IgOFF integrated to obtain QCd-out. (C) Integral of IgOFF. Inset shows QOFF at greater resolution. (D) Plot of QCd-out/QOFF total as a function of Vt and [Cd2+]e. Also shown is a plot of QCd-out versus Vt for control conditions. (E) Plot of QCd-out/QOFF total as a function of Vt for 100 µM Cd2+ and fitted to a Boltzmann function (smooth curve): V1/2 = 27 mV; slope factor = 11.0 mV; maximum value of QCd-out/QOFF total = 0.064.
Figure 6.
Figure 6.
Kinetics of QOFF. (A) Gating currents elicited under control conditions. Top panel is a plot of gating currents in response to voltage pulse protocol shown in the middle panel. Bottom panel shows the first integral of IgOFF traces depicted in top panel. (B) Gating currents, pulse protocol, and integration of currents are shown for the same oocyte after bath application of 30 mM Cd2+. (C) Plot of total QOFF versus pulse duration determined before (filled squares) and after treatment of an oocyte with Cd2+ (open circles). Smooth curves are best fits for single-exponential function (τ = 29 ms for control; τ = 100 ms for Cd2+). (D) Plot of QCd-out in the presence of 30 µM Cd2+ versus pulse duration. Data for pulse durations >70 ms (filled circles) were fitted with a single-exponential function (τ = 95 ms). Thus, after accounting for a delay caused by overlap of the faster rising phase of IgOFF for short pulse durations, the time course of the development of QCd-out matches that of QOFF.
Figure 7.
Figure 7.
Elevated concentration of Ca2+ causes a positive shift in the voltage dependence of the QOFF-V relationship for hERG1, but it does not induce a transient outward component in IgOFF. (A) QOFF-V relationships for hERG1 measured under control conditions ([Ca2+]e = 2 mM) and after the elevation of [Ca2+]e to 10 mM (n = 5). Averaged data were fitted to a Boltzmann function (smooth curves). 2 mM Ca2+: V1/2 = −19.5 ± 0.5 mV and z = 1.87 ± 0.05; 10 mM Ca2+: V1/2 = 6.8 ± 1.9 mV and z = 1.42 ± 0.06. (B) Ig traces recorded in the presence of 2 mM Ca2+ (control) and 10 mM Ca2+ at a test potential of +60 mV. IgOFF was measured at −110 mV. (C) IgOFF traces from B are shown at expanded time (initial 5 ms) and amplitude scales. (D) Gating currents of WT hERG1 channels measured during 300-ms pulses to +40 mV with a holding and return potential of −110 mV. QOFF-V relationships are shown in G. Extracellular concentrations of Ca2+ and Cd2+ are indicated to the left of the current traces. (E) Expanded view of initial IgOFF for the traces shown in D. (F) Currents recorded from an uninjected oocyte using the same pulse protocol as in D with the indicated concentrations of extracellular divalent cations. (G) QOFF-V relationship determined in a single oocyte in the presence of the indicated concentrations of extracellular Ca2+ and Cd2+. For 2 mM Ca2+: QOFF-max = −8.0 nC, V1/2 = −19.6 mV, and z = 2.2. For 10 mM Ca2+: QOFF-max = −12.0 nC, V1/2 = +7.3 mV, and z = 1.6. For 10 mM Ca2+ + 0.1 mM Cd2+: QOFF-max = −9.3 nC, V1/2 = +32 mV, and z = 1.1.
Figure 8.
Figure 8.
Co2+, Zn2+, and La3+ cause a positive shift in the voltage dependence of QOFF-V relationships for hERG1, but they do not induce a transient outward component in IgOFF. (A) QOFF-V relationships for hERG1 measured under control conditions ([Ca2+]e = 2 mM) and after the addition of 3 mM Co2+ (n = 3). Control: V1/2 = −15.9 ± 0.8 mV and z = 2.20 ± 0.08; Co2+: V1/2 = 19.1 ± 0.9 mV and z = 1.34 ± 0.02. (B) Ig traces recorded in the presence of 2 mM Ca2+ (control) and 3 mM Co2+ at a test potential of +60 mV. IgOFF was measured at −110 mV. (C) IgOFF traces from B are shown at expanded time (initial 5 ms) and amplitude scales. (D) QOFF-V relationships for hERG1 measured under control conditions ([Ca2+]e = 2 mM) and after the addition of 1 mM Zn2+ (n = 3). Control: V1/2 = −17.5 ± 0.3 mV and z = 1.82 ± 0.03; Zn2+: V1/2 = 16.4 ± 6.3 mV and z = 0.97 ± 0.06. (E) Ig traces recorded in the presence of 2 mM Ca2+ (control) and 1 mM Zn2+ at a test potential of +60 mV. IgOFF was measured at −110 mV. (F) IgOFF traces from E are shown at expanded time (initial 5 ms) and amplitude scales. (G) QOFF-V relationships for hERG1 measured under control conditions ([Ca2+]e = 2 mM) and after the addition of 10 µM La3+ (n = 3). Control: V1/2 = −20.6 ± 0.4 mV and z = 2.18 ± 0.06; La3+: V1/2 = 19.3 ± 3.9 mV and z = 1.23 ± 0.08. (H) Ig traces recorded in the presence of 2 mM Ca2+ (control) and 10 µM La3+ at a test potential of +60 mV. IgOFF was measured at −110 mV. (I) IgOFF traces from H are shown at expanded time (initial 5 ms) and amplitude scales.
Figure 9.
Figure 9.
Extracellular Cd2+ induces positive shifts in the G-V relationships of D509C and D456C hERG1 channels. (A and B) G-V relationships for D509C hERG1 (A; n = 6) and D456C hERG1 (B; n = 5) channel currents in the absence (control) and presence of 1 mM extracellular Cd2+.
Figure 10.
Figure 10.
Cd2+ enhances ICd-out of WT but not D509C or D456C hERG1 channels. (A) Traces for initial 10 ms of IgOFF of WT hERG1 channels elicited by return of membrane potential to −110 mV from the indicated Vt. (B and C) Traces for initial 10 ms of IgOFF of D509C (B) or D456C hERG1 (C) hERG1 channels elicited by return of membrane potential to −110 mV from the indicated Vt. Current traces for mutant channels are aligned below the traces for WT channels to facilitate comparisons based on measured shifts in the V1/2 for activation of ionic currents. For all panels, black traces represent control currents, and red traces represent currents after treatment of an oocyte with 0.1 mM (WT channels) or 0.3 mM (mutant channels) CdCl2.
Figure 11.
Figure 11.
RPR260243 has no effect on hERG1 channel gating currents. (A) Gating currents for WT hERG1 channels measured at test potentials of −10 and +40 mV before (black traces) or 25 min after exposure of an oocyte to 30 µM RPR260243 (red traces). For these experiments, the currents were filtered at 5 kHz and digitized at 20 kHz. (B) Average QOFF-V relationships determined under control conditions and after the treatment of the same oocytes with 30 µM RPR260243 for 20–25 min (n = 5). QOFF was normalized to the peak of the control value for each oocyte. Data were fitted with a Boltzmann function (smooth curves). In control conditions, V1/2 = −18.6 ± 0.5 mV and z = 1.84 ± 0.01. In the presence of RPR260243, V1/2 = −19.0 ± 0.5 mV and z = 1.88 ± 0.01.
Figure 12.
Figure 12.
Averaged and normalized Ig of WT hERG1 channels measured using p/−8 leak and capacitance current subtraction. (A) Ig in response to test voltages Vt of −60, −30, …+60 mV during 0–300 ms. The membrane voltage is clamped to −110 mV otherwise. (B and C) IgON at 0–10 ms and 10–300 ms, respectively. (D and E) IgOFF at 300–310 ms and 310–600 ms, respectively.
Figure 13.
Figure 13.
Schematics of Markov model for gating and ionic currents of WT hERG1 channels. The model consists of two components, one for voltage sensing with the states S0 to S14 (A) and the other for activation and inactivation with the states C0, C1, O, and I (B). The coupling between the components is via the rate coefficient αC0,C1, which is a function of the states S4, S8, S11, S13, and S14 in the component for voltage sensing.
Figure 14.
Figure 14.
Features of measured and modeled Ig. Q-Vt relationships for IgON (A) and IgOFF (B). Time constants–Vt relationships for IgON (C) and IgOFF (D). Relationship of exponential fit coefficients to Vt for IgON (E) and IgOFF (F).
Figure 15.
Figure 15.
Modeled Ig of WT hERG1 channels. (A) Ig in response to the voltage-clamping protocol used in Fig. 12. (B and C) IgON at 0–10 ms and 10–300 ms, respectively. (D and E) IgOFF at 300–310 ms and 310–600 ms, respectively. (F) The initial phase (0–1 ms) of IgON is primarily carried by the fast transition between S0 and S1. (G) The slow decay of IgON between 2 and 10 ms is caused by a mixture of increasing and decreasing gating currents associated with the slow transitions in the gating model.
Figure 16.
Figure 16.
Averaged and normalized Ig of WT hERG1 channels measured in the presence of extracellular Cd2+. (A) Ig measured with test voltages Vt of −60, −30,…+60 mV. The membrane voltage is −110 mV otherwise. (B and C) IgON at 0–10 ms and 10–300 ms, respectively. (D and E) IgOFF at 300–310 ms and 310–600 ms, respectively.
Figure 17.
Figure 17.
Schematics of Markov model for Ig of WT hERG1 channels in the presence of extracellular Cd2+. The model extends the description of Ig in Fig. 13 A with states and transitions describing the movement of Cd2+. States S0 to S14 (green) describe hERG1 configurations with Cd2+ bound to a site in the VSD. States S15 to S24 (blue), and S25 to S30 (brown), are associated with hERG1 configurations having one and two Cd2+ ions moved in the VSD, respectively.
Figure 18.
Figure 18.
Features of measured and modeled Ig in the presence of extracellular Cd2+. (A) Maximal IgON-Vt relationship. (B) Maximal IgOFF-Vt relationship. Time constants–Vt relationships for IgON (C) and IgOFF (D). Relationship of exponential fit coefficients to Vt for IgON (E) and IgOFF (F).
Figure 19.
Figure 19.
Modeled Ig of WT hERG1 channels in the presence of extracellular Cd2+. (A) Ig in response to the voltage-clamping protocol used in Fig. 12. (B and C) IgON at 0–10 ms and 10–300 ms, respectively. (D and E) IgOFF at 300–310 ms and 310–600 ms, respectively. (F) Gating current (Ig) caused by movement of VSD and current conducted by Cd2+ (ICd) for a 300-ms voltage step to +60 mV, followed by a return to the holding potential of −110 mV. The sum of these two currents produces the gating currents simulated to occur in the presence of Cd2+. (G) Currents underlying the initial 2 ms of IgOFF (300–302 ms). Major contributors to initial IgOFF are Cd2+currents (ICd) related to transitions between S19–S25 and S24–S30 (black) and between S5–S15 and S14–S24 (pink). Currents related to VSD movement (red, green, and blue) have a small contribution to initial IgOFF but dominate after decay of ICd.
Figure 20.
Figure 20.
Schematic showing state-dependent positions of Cd2+ and key charged residues in S2–S4 segments of the VSD of a single hERG1 channel subunit. According to this model, Cd2+ is displaced in an outward direction by basic residues in the S4 segment as it moves inward in response to membrane repolarization. (Left) VSD at depolarized potentials and Cd2+ in its “depolarized” coordination site. (Right) VSD at a negative transmembrane potential when all channels are closed and Cd2+ located in a position defined as the “repolarized” coordination site. (Middle) A putative intermediate state of the channel. K1, K525; R2, R528; R3, R531; R4, R534; D1, D456; D2, D460; D3, D509. The yellow circle represents a Cd2+ ion.

References

    1. Aggarwal S.K., MacKinnon R. 1996. Contribution of the S4 segment to gating charge in the Shaker K+ channel. Neuron. 16:1169–1177 10.1016/S0896-6273(00)80143-9 - DOI - PubMed
    1. Ahern C.A., Horn R. 2005. Focused electric field across the voltage sensor of potassium channels. Neuron. 48:25–29 10.1016/j.neuron.2005.08.020 - DOI - PubMed
    1. Anumonwo J.M., Horta J., Delmar M., Taffet S.M., Jalife J. 1999. Proton and zinc effects on HERG currents. Biophys. J. 77:282–298 10.1016/S0006-3495(99)76889-X - DOI - PMC - PubMed
    1. Armstrong C.M., Bezanilla F. 1977. Inactivation of the sodium channel. II. Gating current experiments. J. Gen. Physiol. 70:567–590 10.1085/jgp.70.5.567 - DOI - PMC - PubMed
    1. Cherny V.V., DeCoursey T.E. 1999. pH-dependent inhibition of voltage-gated H+ currents in rat alveolar epithelial cells by Zn2+ and other divalent cations. J. Gen. Physiol. 114:819–838 10.1085/jgp.114.6.819 - DOI - PMC - PubMed

Publication types

MeSH terms