. 2010 Aug 10;107(32):14443-8.
doi: 10.1073/pnas.0913496107. Epub 2010 Jul 26.

Exogenous fms-like tyrosine kinase 3 ligand overrides brain immune privilege and facilitates recognition of a neo-antigen without causing autoimmune neuropathology

Affiliations

Exogenous fms-like tyrosine kinase 3 ligand overrides brain immune privilege and facilitates recognition of a neo-antigen without causing autoimmune neuropathology

Daniel Larocque et al. Proc Natl Acad Sci U S A. .

Abstract

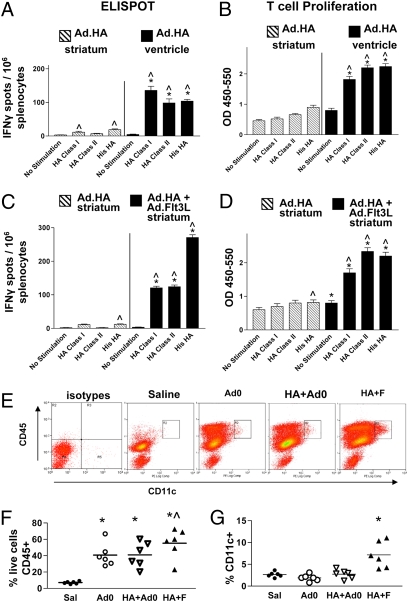
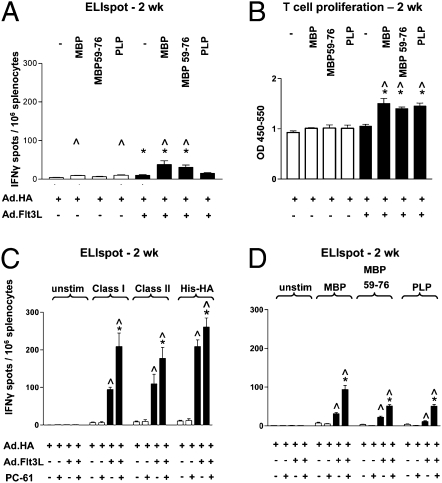
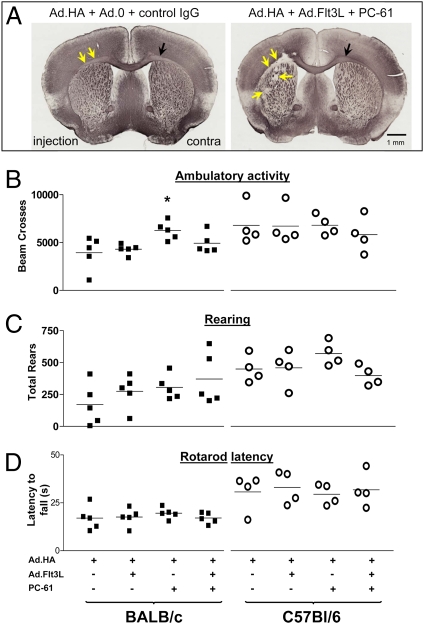
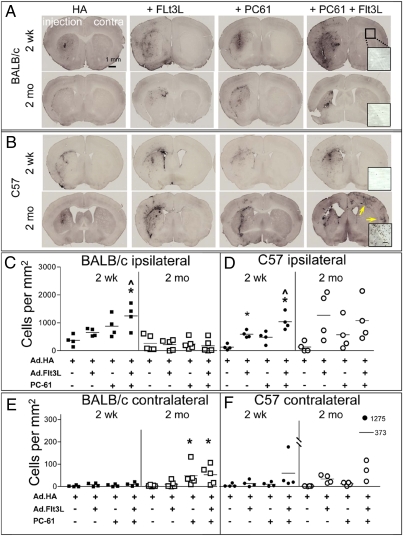
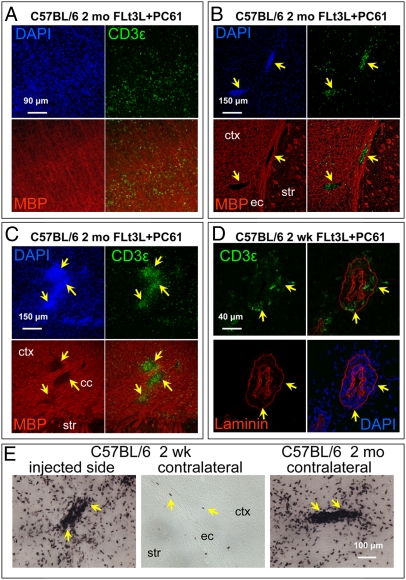
Soluble antigens diffuse out of the brain and can thus stimulate a systemic immune response, whereas particulate antigens (from infectious agents or tumor cells) remain within brain tissue, thus failing to stimulate a systemic immune response. Immune privilege describes how the immune system responds to particulate antigens localized selectively within the brain parenchyma. We believe this immune privilege is caused by the absence of antigen presenting dendritic cells from the brain. We tested the prediction that expression of fms-like tyrosine kinase ligand 3 (Flt3L) in the brain will recruit dendritic cells and induce a systemic immune response against exogenous influenza hemagglutinin in BALB/c mice. Coexpression of Flt3L with HA in the brain parenchyma induced a robust systemic anti-HA immune response, and a small response against myelin basic protein and proteolipid protein epitopes. Depletion of CD4(+)CD25+ regulatory T cells (Tregs) enhanced both responses. To investigate the autoimmune impact of these immune responses, we characterized the neuropathological and behavioral consequences of intraparenchymal injections of Flt3L and HA in BALB/c and C57BL/6 mice. T cell infiltration in the forebrain was time and strain dependent, and increased in animals treated with Flt3L and depleted of Tregs; however, we failed to detect widespread defects in myelination throughout the forebrain or spinal cord. Results of behavioral tests were all normal. These results demonstrate that Flt3L overcomes the brain's immune privilege, and supports the clinical development of Flt3L as an adjuvant to stimulate clinically effective immune responses against brain neo-antigens, for example, those associated with brain tumors.


Conflict of interest statement

The authors declare no conflict of interest.

Figures

Fig. 1.
Fig. 1.
Immune privilege of brain parenchyma can be overcome by Flt3L. (A) Seven days after injection into striatum (hatched bars) or into ventricle (solid bars), splenocytes were stimulated with either the HA class I peptide, HA class II peptide, or His-HA protein or unstimulated before quantification of IFNγ production by ELIspot. ^P < 0.05 vs. corresponding no stimulation group; *P < 0.05 vs. splenocytes from intrastriatally injected animals incubated with same stimuli; n = 5/group. (B) Splenocytes were stimulated with either the HA class I peptide, HA class II peptide, or His-HA protein, or as controls, unstimulated. BrdU incorporation into nascent DNA strands was measured by ELISA to determine relative proliferation of T lymphocytes (vertical axis represents optical density). ^P < 0.05 vs. corresponding no stimulation group; *P < 0.05 vs. splenocytes from intrastriatally injected animals incubated with same stimuli; n = 5/group. (C and D) HA-specific immune response in animals injected in striatal parenchyma with Ad.HA alone (hatched bars), or with coinjection of Ad.FLt3L (solid bars). Seven days after injection, cells were isolated from spleens and characterized by ELIspot (C) or T cell proliferation assay (D). Layout and statistics for these figures are identical to A and B. Error bars indicate SEM. (E) Representative flow cytometry dot plots showing effect of Flt3L injection on numbers of CD45 and CD11c immunopositive cells infiltrating the brain. Intact cells were gated on forward and side scatter. First panel shows cells incubated with control antibodies; remaining four panels show, from left to right, cells from animals injected with saline, 6 × 10⁷ Ad.0, 1 × 10⁷ Ad.HA + 5 × 10⁷ Ad.0, and 1 × 10⁷ Ad.HA + 5 × 10⁷ Ad.Flt3L. Numbers of cells in rectangle marked R2 were used to prepare column scatter graph in G. (F) Percentage of live cells extracted from brains immunopositive for CD45, by group. *P < 0.05 vs. saline; ^P < 0.05 vs. Ad.0 or HA+Ad.0. (G) Percentage of CD45+ cells also CD11c positive. *P < 0.05 vs. saline. Data from individuals closest to mean value were chosen for representative dot plots in E.
Fig. 2.
Fig. 2.
Minor immune response against self-brain antigen is induced by injection of Ad.Flt3L and HA, and augmented by Treg depletion. (A and B) Ad.HA alone (open bars) or Ad.HA + Ad.Flt3L (filled bars) were injected in the left striata of BALB/c mice. (A) Fourteen days after vector injection, splenocytes were stimulated with MBP pure protein, the MBP 59–67 peptide, or the PLP 139 peptide, or unstimulated before quantification of IFNγ production by ELIspot. *P < 0.05 vs. splenocytes from Ad.HA-injected animals (i.e., no Flt3L) incubated with same stimulus; ^P < 0.05 vs. corresponding no stimulation group; n = 5/group. (B) Splenocytes were stimulated with MBP pure protein, MBP 59–67 peptide, or PLP 139 peptide, or as controls, unstimulated. BrdU incorporation into nascent DNA strands was measured to determine relative proliferation of T lymphocytes lymphocytes (vertical axis represents optical density). *P < 0.05 vs. splenocytes from Ad.HA-injected animals (i.e., no Flt3L) incubated with same stimuli; ^P < 0.05 vs. corresponding no stimulation group; n = 5/group. (C and D) Effect of Treg depletion. Ad.HA alone (open bars) or Ad.HA + Ad.Flt3L (filled bars) was injected into the left striata of BALB/c mice. Tregs were depleted by systemic administration of PC-61 or with saline as a control. Two weeks later, animals were euthanized and splenocytes were isolated for ELISPOT assays. (C) The frequency of HA-specific IFNγ secreting T lymphocytes was quantified after stimulation with either the HA class I peptide, HA class II peptide, or His-HA protein, or as controls, unstimulated. *P < 0.05 vs. saline depletion of the same vector treatment and stimulation group; ^P < 0.05 vs. splenocytes from Ad.HA-injected (i.e., no FLt3L) animals in the same depletion and stimulation group; n = 5. (D) Frequency of myelin or PLP-specific, IFNγ-secreting T lymphocytes was quantified following stimulation with MBP pure protein, MBP 59–67 peptide, or PLP 139 peptide, or as controls, unstimulated. Data were analyzed by two-way ANOVA followed by Tukey–Kramer multiple comparison test. *P < 0.05 vs. saline depletion of same vector treatment and stimulation group; ^P < 0.05 vs. splenocytes from Ad.HA-injected (i.e., no Flt3L) animals in the same depletion and stimulation group; n = 5/group. Error bars indicate SEM.
Fig. 3.
Fig. 3.
Myelin lesions in C57BL/6and BALB/c mice injected with Flt3L and depleted of Tregs are restricted to injected hemisphere and do not affect behavior. (A) Coronal brain sections immunolabeled for MBP from C57BL/6 mice injected with 1 × 10⁷ Ad.HA + 5 × 10⁷ Ad.0 and treated with a control antibody (Left), or 1 × 10⁷ Ad.HA + 5 × 10⁷ Ad.Flt3L and PC-61 (Right). Yellow arrows on right image indicate destruction of white matter in injected hemisphere (injection); black arrow shows intact white matter contralaterally (contra). Little damage is visible in the animal not treated with FLt3L or PC61 (Left). (B) Ambulatory activity of mice in open field trials. Vertical axis shows number of times that mice crossed light beams in a 60-min trial. Left four columns show data from BALB/c mice; right four columns show data from C57BL/6 mice. *P < 0.05 vs. group treated with Ad.HA only (i.e., no Flt3L or PC-61). (C). Rearing data do not show any behavioral effects of treatments. (D) Mice were placed on a rod that was then rotated at slowly increasing speed until the mouse fell. Latency to fall was recorded (vertical axis). There were no statistically significant differences between groups.
Fig. 4.
Fig. 4.
T cell infiltration at 2 wk and 2 mo following administration of Ad.HA and Ad.Flt3L, and depletion of Tregs with PC61. (A) Coronal sections of BALB/c mice injected with combinations of vectors and antibodies indicated at top of figure and perfused at time point indicated at left of figure and immunolabeled for CD3ε (pan-T cell marker). Images are from a representative section from the brain most extensively infiltrated with T cells from each group. Injected hemisphere (injection), noninjected hemisphere (contra), and scale bar representing 1 mm are all indicated (Top Left) and are the same throughout. (B) Sections from C57BL/6 mice. Layout is identical to that in A. Yellow arrows (Bottom Right) indicate infiltration in the contralateral hemisphere. Insets, Top Right in rightmost panels, are higher-ower images of contralateral external capsule, showing degree of T cell infiltration. (Scale bar, 100 μm.) (C) Numbers of CD3ε immunoreactive T cells in injected striatum of each BALB/c mouse by time point and treatment group. Cells were counted in the most extensively infiltrated section and expressed as number per square millimeter of area of striatum in that section. *P < 0.05 vs. Ad.HA (i.e., no Flt3L or PC-61) group at same time point; ^P < 0.05 vs. equivalent group at 2-mo time point. (D) Corresponding counts for C57BL/6 mice. *P < 0.05 vs. Ad.HA group at same time point; ^P < 0.05 vs. Ad.HA+PC-61 group. (E and F) Similar counts for contralateral cortex + corpus callosum. This area was chosen because it contained noticeably more T cells than the contralateral striatum. *P < 0.05 vs. Ad.HA group at same time point. One C57BL/6 mouse had very extensive T cell infiltration in the contralateral cortex (B, Bottom Right), and the count for this animal is plotted in F with a filled circle at an arbitrary location, with the numerical value indicated beside the plotted point to facilitate graphing; similarly, as the mean for this group is off-scale, the mean is represented with a bar in an arbitrary location with its numerical value beside the bar. Disparate intergroup variance in this dataset, even following log or other transformation, precluded analysis of variance.
Fig. 5.
Fig. 5.
T cells are scattered through cortex and cluster in perivascular cuffs. (A–C) Immunofluorescent labeling of MBP (red) and CD3ε (green) in coronal sections of C57BL/6 mouse brains from Flt3L-treated, Treg-depleted, 2-mo group. All images are maximum projections of confocal stacks from the hemisphere contralateral to the injection. A is from the dorsal cortex; B is from the lateral striatum (str), external capsule (ec), and adjacent cortex (ctx); and C is from the dorsal aspect of the corpus callosum (cc). (D) immunofluorescent labeling of CD3ε (green) and laminin (red) in a coronal section of a C57BL/6 mouse from Flt3L-treated, Treg-depleted, 2-wk group. Image is a single confocal section taken from a ventromedial location within the injected striatum. Notice the accumulation of T cells within perivascular cuffs. Yellow arrows indicate same regions in different channels. (E) Immunoperoxidase labeling of CD3ε. (Left) Image from a C57BL/6 mouse from Flt3L-treated, Treg-depleted, 2-wk group; image is taken from dorsal striatum (str) of injected hemisphere. (Middle) Image from same section, illustrating contralateral external capsule (ec) and adjacent cortex (ctx). (Right) Image from a C57 mouse from the Flt3L-treated, Treg-depleted, 2-mo group, captured in a location similar to that of the Middle image. (Scale bar, 100 μm.) Yellow arrows indicate perivascular cuffs.

Similar articles

Cited by

References

    1. Mrass P, Weninger W. Immune cell migration as a means to control immune privilege: Lessons from the CNS and tumors. Immunol Rev. 2006;213:195–212. - PubMed
    1. Arck PC, Gilhar A, Bienenstock J, Paus R. The alchemy of immune privilege explored from a neuroimmunological perspective. Curr Opin Pharmacol. 2008;8:480–489. - PubMed
    1. Galea I, Bechmann I, Perry VH. What is immune privilege (not)? Trends Immunol. 2007;28:12–18. - PubMed
    1. Lowenstein PR. Immunology of viral-vector-mediated gene transfer into the brain: An evolutionary and developmental perspective. Trends Immunol. 2002;23:23–30. - PubMed
    1. Perry VH. A revised view of the central nervous system microenvironment and major histocompatibility complex class II antigen presentation. J Neuroimmunol. 1998;90:113–121. - PubMed

Publication types