Clinical Trial
. 2010 Nov 11;116(19):3818-27.
doi: 10.1182/blood-2010-05-285080. Epub 2010 Jul 26.

Elevated frequencies of highly activated CD4+ T cells in HIV+ patients developing immune reconstitution inflammatory syndrome

Affiliations
Clinical Trial

Elevated frequencies of highly activated CD4+ T cells in HIV+ patients developing immune reconstitution inflammatory syndrome

Lis R V Antonelli et al. Blood. .

Abstract

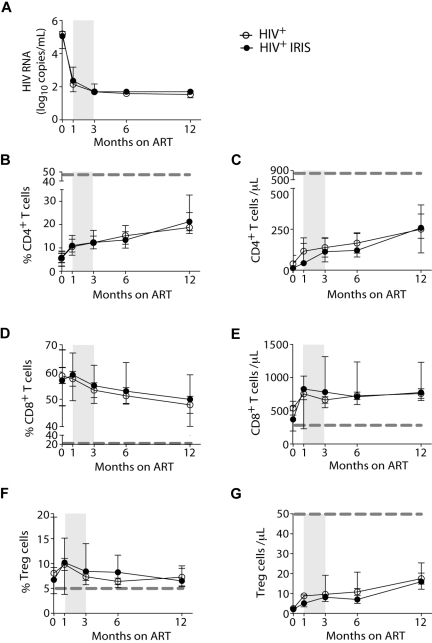
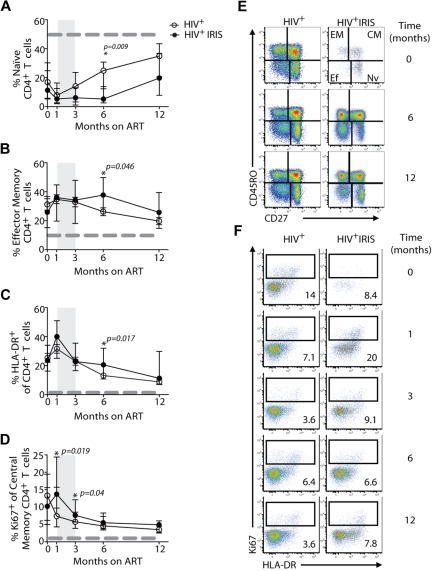
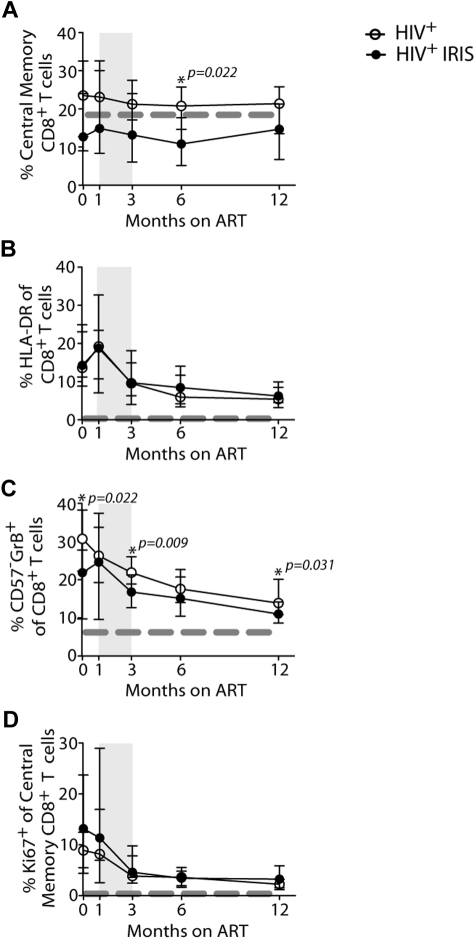
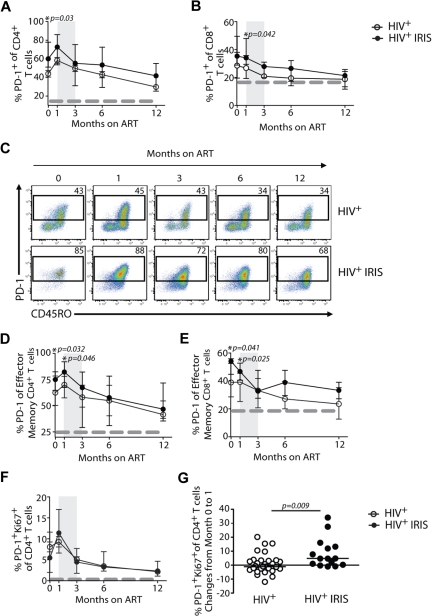
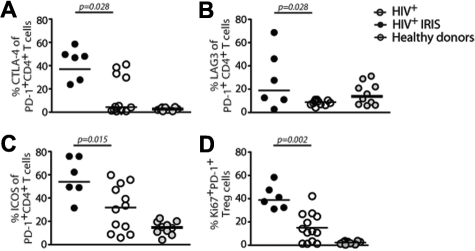
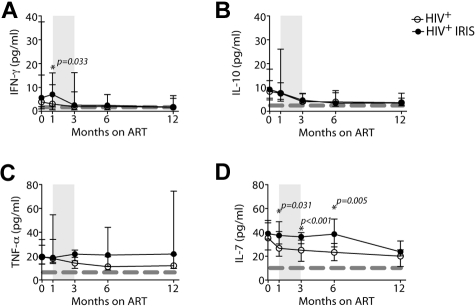
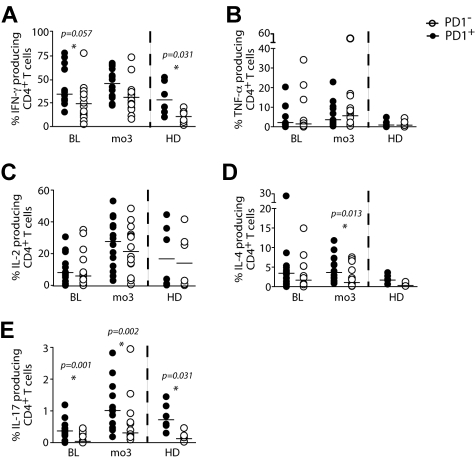
Immune reconstitution inflammatory syndrome (IRIS) is a considerable problem in the treatment of HIV-infected patients. To identify immunologic correlates of IRIS, we characterized T-cell phenotypic markers and serum cytokine levels in HIV patients with a range of different AIDS-defining illnesses, before and at regular time points after initiation of antiretroviral therapy. Patients developing IRIS episodes displayed higher frequencies of effector memory, PD-1(+), HLA-DR(+), and Ki67(+) CD4(+) T cells than patients without IRIS. Moreover, PD-1(+) CD4(+) T cells in IRIS patients expressed increased levels of LAG-3, CTLA-4, and ICOS and had a Th1/Th17 skewed cytokine profile upon polyclonal stimulation. Elevated PD-1 and Ki67 expression was also seen in regulatory T cells of IRIS patients. Furthermore, IRIS patients displayed higher serum interferon-γ, compared with non-IRIS patients, near the time of their IRIS events and higher serum interleukin-7 levels, suggesting that the T-cell populations are also exposed to augmented homeostatic signals. In conclusion, our findings indicate that IRIS appears to be a predominantly CD4-mediated phenomenon with reconstituting effector and regulatory T cells showing evidence of increased activation from antigenic exposure. These studies are registered online at http://clinicaltrials.gov as NCT00557570 and NCT00286767.


Figures

Figure 1
Figure 1
HIV-1+ patients developing IRIS and non-IRIS HIV+ controls display the same HIV-RNA levels and T-cell reconstitution in response to ART. HIV-RNA was measured before and 1, 3, 6, and 12 months after ART initiation (A). Proportion and absolute numbers of CD4+ (B-C), CD8+ (D-E), and regulatory T (F-G) cells were measured before and several months after ART initiation, as indicated. Open and filled symbols represent HIV+ control patients and HIV+ patients who developed at least one IRIS episode, respectively. The shaded area represents the IQR of the time of initiation of IRIS episodes. Dotted lines represent median values of the given measurements in healthy donors.
Figure 2
Figure 2
IRIS patients display a distinct activation status during reconstitution after ART therapy. The percentage of naive (CD45ROCD27+; A) effector memory (CD45RO+CD27; B) and HLA-DR+ (C) cells within CD4+ T lymphocytes, and Ki67+ cells within central memory CD4+ T lymphocytes (D) in HIV+ controls (open symbols) and HIV+ IRIS patients (filled symbols) were measured before and during ART. The shaded area represents the IQR of the time of initiation of IRIS episode. Dotted lines represent median values of the given measurements in healthy donors. Representative dot plots showing proportions of naive (Nv), central memory (CM), effector memory (EM), and effector (Ef) CD4+ T cells (E) and frequencies of Ki67+ cells within central memory CD4+ T lymphocytes (F) from a single HIV+ non-IRIS (left panel) and a single HIV+ IRIS patient (right panel) are shown.
Figure 3
Figure 3
Activation status of CD8+ T cells during reconstitution in HIV+ non-IRIS and HIV+ IRIS patients before and during ART. The percentage of central memory (CD45RO+CD27+; A), HLA-DR+ (B), and CD57GrB+ (C) cells within CD8+ T lymphocytes and Ki67+ (E) cells within central memory CD8+ T lymphocytes in HIV+ non-IRIS (open symbols) and HIV+ IRIS patients (filled symbols) were measured before and after ART initiation. The shaded area represents the IQR of IRIS episodes. Dotted lines represent median of the given measurement in healthy donors.
Figure 4
Figure 4
Higher frequencies of PD-1 expressing cells are found in IRIS patients before ART initiation. The percentage of PD-1 expression within CD4+ T and CD8+ T lymphocytes in HIV+ controls (open symbols) and HIV+ IRIS patients (filled symbols) were measured before and after ART initiation (A-B). Representative dot plots showing PD-1 expression on CD4+ T cells throughout study follow-up. Upper dot plots represent a single HIV+ control patient and lower dot plots represent a single HIV+ patient who developed one IRIS episode (C). The percentage of PD-1 expression within the effector memory compartment of CD4+ T and CD8+ T cells in HIV+ controls (open symbols) and HIV+ IRIS patients (filled symbols) were measured before and after ART initiation (D-E). Percentage of PD-1+Ki67+ expression within CD4+ T lymphocytes was measured before and 1, 3, 6, and 12 months after ART initiation. The dotted line represents median of the given measurement from healthy donors (F). The shaded area represents the IQR of the time of initiation of IRIS episodes, and dotted lines represent median of the given measurements from healthy donors (A-B, D-F). Symbols represent changes in the frequency of PD-1+Ki67+ cells among CD4+ T cells in individual patients from baseline to month 1 after ART initiation (G).
Figure 5
Figure 5
Higher frequencies of PD-1+CD4+ T cells expressing CTLA-4, LAG-3, or ICOS are found in IRIS patients before ART initiation. The percentage of CTLA-4+ (A), LAG-3+ (B), and ICOS+ (C) cells within PD-1+CD4+ T lymphocytes in HIV+ controls (open symbols), HIV+ IRIS patients (black symbols) were measured before ART initiation. The same molecules were measured in healthy donors (gray symbols). Percentage of PD-1+Ki67+ expression within Treg was also measured (D).
Figure 6
Figure 6
IRIS patients display higher levels of serum IFN-γ and IL-7 than non-IRIS patients. The cytokines, IFN-γ (A), IL-10 (B), TNF-α (C), and IL-7 (D), were measured in the serum of HIV+ controls (open symbols) and HIV+ IRIS patients (filled symbols) before and 1, 3, 6, and 12 months after ART initiation. The shaded area represents the IQR of the time of initiation of IRIS episodes. Dotted lines represent medians of the given measurements from healthy donors.
Figure 7
Figure 7
PD-1 expressing cells produce more IFN-γ in response to polyclonal stimulation in comparison to PD-1 CD4+ T cells. Cryopreserved PBMCs were thawed and cultured for 5 hours in the presence of PMA, ionomycin, and Brefeldin-A. The percentage of IFN-γ (A), TNF-α (B), IL-2 (C), IL-4 (D), and IL-17 (E) expression within PD-1+ (filled symbols) and PD-1 (open symbols) CD4+ T lymphocytes in HIV+ (controls and IRIS) patients were measured before and 3 months after ART initiation, as well as in healthy donors (HD). Symbols represent frequencies of cytokine-producing cells after PMA/ionomycin stimulation minus background cytokine production in unstimulated controls.

References

    1. French M, Colebunders R. Immune restoration disease. Curr Opin HIV AIDS. 2008;3(4):417–418. - PubMed
    1. Murdoch DM, Venter WD, Feldman C, Van Rie A. Incidence and risk factors for the immune reconstitution inflammatory syndrome in HIV patients in South Africa: a prospective study. AIDS. 2008;22(5):601–610. - PubMed
    1. Shelburne SA, Visnegarwala F, Darcourt J, et al. Incidence and risk factors for immune reconstitution inflammatory syndrome during highly active antiretroviral therapy. AIDS. 2005;19(4):399–406. - PubMed
    1. Meintjes G, Lawn SD, Scano F, et al. Tuberculosis-associated immune reconstitution inflammatory syndrome: case definitions for use in resource-limited settings. Lancet Infect Dis. 2008;8(8):516–523. - PMC - PubMed
    1. Bourgarit A, Carcelain G, Martinez V, et al. Explosion of tuberculin-specific Th1-responses induces immune restoration syndrome in tuberculosis and HIV co-infected patients. AIDS. 2006;20(2):F1–7. - PubMed

Publication types

MeSH terms

Associated data