Genomic binding profiling of the fission yeast stress-activated MAPK Sty1 and the bZIP transcriptional activator Atf1 in response to H2O2
- PMID: 20661279
- PMCID: PMC2905393
- DOI: 10.1371/journal.pone.0011620
Genomic binding profiling of the fission yeast stress-activated MAPK Sty1 and the bZIP transcriptional activator Atf1 in response to H2O2
Abstract
Background: The evolutionally conserved MAPK Sty1 and bZIP transcriptional activator Atf1 are known to play a pivotal role in response to the reactive oxygen species in S. pombe. However, it is unclear whether all of the H(2)O(2)-induced genes are directly regulated by the Sty1-Atf1 pathway and involved in growth fitness under H(2)O(2)-induced stress conditions.
Methodology/principal findings: Here we present the study on ChIP-chip mapping of the genomic binding sites for Sty1, Atf1, and the Atf1's binding partner Pcr1; the genome-wide transcriptional profiling of the atf1 and pcr1 strains in response to H(2)O(2); and the phenotypic assessment of approximately 90 Atf1/Pcr1-bound or unbound genes for growth fitness under H(2)O(2) conditions. ChIP-chip analysis shows that Atf1 and Pcr1 binding sites are overlapped in the genome and constitutively present before H(2)O(2) stress. On the other hand, Sty1 recruitment primarily occurs at the Atf1/Pcr1 binding sites and is induced by H(2)O(2). We found that Atf1/Pcr1 is clearly responsible for the high-level transcriptional response to H(2)O(2). Furthermore, phenotypic assessment indicates that among the H(2)O(2)-induced genes, Atf1/Pcr1-bound genes exhibit a higher likelihood of functional requirement for growth fitness under the stress condition than the Atf1/Pcr1-unbound genes do. Notably, we found that the Atf1/Pcr1-bound genes regardless of their responsiveness to H(2)O(2) show a high probability of requirement for growth fitness.
Conclusion/significance: Together, our analyses on global mapping of protein binding sites, genome-wide transcriptional profiling, and phenotypic assessment provide insight into mechanisms for global transcriptional regulation by the Sty1-Atf1 pathway in response to H(2)O(2)-induced reactive oxygen species.
Conflict of interest statement
Figures
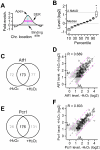
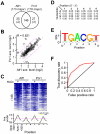
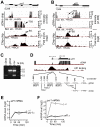
 cells. Error bar indicates the variation in three repeated measurements. (F) Transcriptional profile of pcr1 in response to H2O2 treatment.
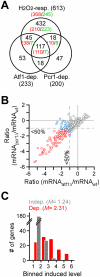
 or pcr1
 cells and wild type cells. The scale is in log2. Each dot indicates a H2O2-induced gene. Genes whose transcriptional response is dependent on both Atf1 and Pcr1, one of Atf1 and Pcr1, or none are indicated by red dots, blue dots, or grey dots. Average transcriptional levels of three repeats at 30, 60, and 120min after H2O2 treatment are used. (C) Histogram showing the number of genes at various levels of average transcriptional induction upon H2O2 treatment.
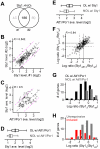
 or pcr1
 and wild type cells. The solid line indicates the median and the dash line indicates the ratio at 50% reduction (−0.585 in log2 scale). (G) Histogram showing the number of Sty1-bound genes that exhibit various ratios between Sty1 enrichment levels in atf1
 /pcr1
/pcr1
 and wild type cells. Sty1-bound genes that are also Atf1/Pcr1-bound (OL w/) or not bound (NOL w/) are indicated in black or grey. (H) Histogram showing the number of Sty1-bound Atf1/Pcr1-bound genes that exhibit various ratios between Sty1 enrichment levels in atf1
 /pcr1
/pcr1
 and wild type cells. Genes that are induced or unresponsive upon H2O2 treatment are indicated by red or grey bars. The arrow indicates the cutoff for the Atf1/Pcr1-dependently Sty1-recrutied genes.
Similar articles
-
Regulation of Schizosaccharomyces pombe Atf1 protein levels by Sty1-mediated phosphorylation and heterodimerization with Pcr1.J Biol Chem. 2007 Feb 23;282(8):5160-70. doi: 10.1074/jbc.M608526200. Epub 2006 Dec 20. J Biol Chem. 2007. PMID: 17182615
-
Transcription factors Pcr1 and Atf1 have distinct roles in stress- and Sty1-dependent gene regulation.Eukaryot Cell. 2008 May;7(5):826-35. doi: 10.1128/EC.00465-07. Epub 2008 Mar 28. Eukaryot Cell. 2008. PMID: 18375616 Free PMC article.
-
Fission yeast MAP kinase Sty1 is recruited to stress-induced genes.J Biol Chem. 2008 Apr 11;283(15):9945-56. doi: 10.1074/jbc.M710428200. Epub 2008 Feb 4. J Biol Chem. 2008. PMID: 18252721 Free PMC article.
-
Nuclear roles and regulation of chromatin structure by the stress-dependent MAP kinase Sty1 of Schizosaccharomyces pombe.Mol Microbiol. 2011 Nov;82(3):542-54. doi: 10.1111/j.1365-2958.2011.07851.x. Epub 2011 Oct 13. Mol Microbiol. 2011. PMID: 21992435 Review.
-
Phospho-mimicking Atf1 mutants bypass the transcription activating function of the MAP kinase Sty1 of fission yeast.Curr Genet. 2018 Feb;64(1):97-102. doi: 10.1007/s00294-017-0730-7. Epub 2017 Aug 10. Curr Genet. 2018. PMID: 28799013 Review.
Cited by
-
RNAi keeps Atf1-bound stress response genes in check at nuclear pores.Genes Dev. 2012 Apr 1;26(7):683-92. doi: 10.1101/gad.186866.112. Epub 2012 Mar 19. Genes Dev. 2012. PMID: 22431512 Free PMC article.
-
Facultative heterochromatin formation in rDNA is essential for cell survival during nutritional starvation.Nucleic Acids Res. 2022 Apr 22;50(7):3727-3744. doi: 10.1093/nar/gkac175. Nucleic Acids Res. 2022. PMID: 35348762 Free PMC article.
-
Oxidative stress response pathways in fungi.Cell Mol Life Sci. 2022 Jun 1;79(6):333. doi: 10.1007/s00018-022-04353-8. Cell Mol Life Sci. 2022. PMID: 35648225 Free PMC article. Review.
-
Protein determinants of meiotic DNA break hot spots.Mol Cell. 2013 Mar 7;49(5):983-96. doi: 10.1016/j.molcel.2013.01.008. Epub 2013 Feb 7. Mol Cell. 2013. PMID: 23395004 Free PMC article.
-
A stress-activated, p38 mitogen-activated protein kinase-ATF/CREB pathway regulates posttranscriptional, sequence-dependent decay of target RNAs.Mol Cell Biol. 2013 Aug;33(15):3026-35. doi: 10.1128/MCB.00349-13. Epub 2013 Jun 3. Mol Cell Biol. 2013. PMID: 23732911 Free PMC article.
References
-
- Finkel T, Holbrook NJ. Oxidants, oxidative stress and the biology of ageing. Nature. 2000;408:239–247. - PubMed
-
- Halliwell B, Gutteridge JMC. Free radicals in Biology and Medicine. Oxford, United Kingdom: Oxford University Press; 1999.
-
- Temple MD, Perrone GG, Dawes IW. Complex cellular responses to reactive oxygen species. Trends Cell Biol. 2005;15:319–326. - PubMed
-
- Veal EA, Day AM, Morgan BA. Hydrogen peroxide sensing and signaling. Mol Cell. 2007;26:1–14. - PubMed
-
- Rhee SG. Cell signaling. H2O2, a necessary evil for cell signaling. Science. 2006;312:1882–1883. - PubMed
Publication types
MeSH terms
Substances
LinkOut - more resources
Full Text Sources
Molecular Biology Databases

