. 2010 Jul 2:4:47.
doi: 10.3389/fnhum.2010.00047. eCollection 2010.

Decoding developmental differences and individual variability in response inhibition through predictive analyses across individuals

Affiliations

Decoding developmental differences and individual variability in response inhibition through predictive analyses across individuals

Jessica R Cohen et al. Front Hum Neurosci. .

Abstract

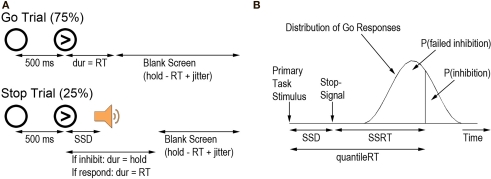
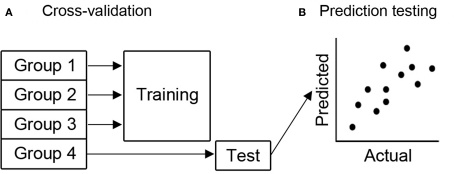
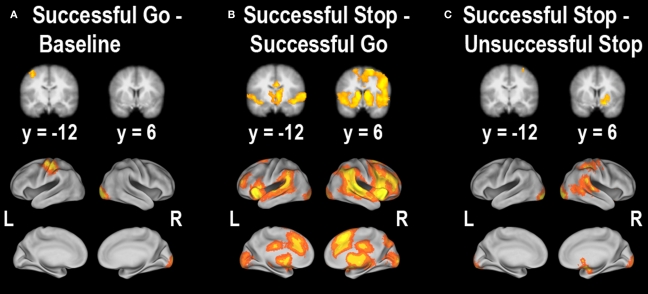
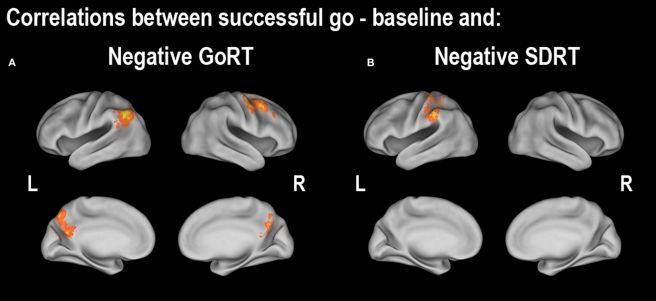
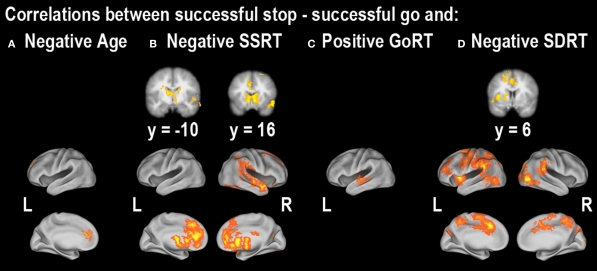
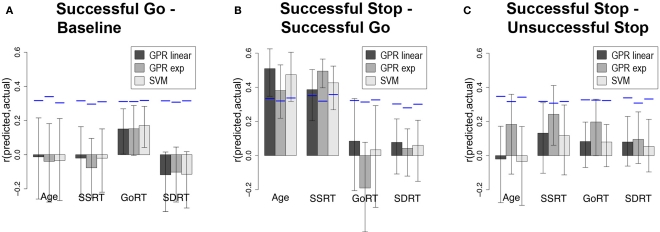
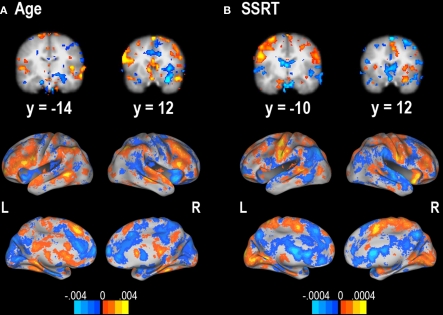
Response inhibition is thought to improve throughout childhood and into adulthood. Despite the relationship between age and the ability to stop ongoing behavior, questions remain regarding whether these age-related changes reflect improvements in response inhibition or in other factors that contribute to response performance variability. Functional neuroimaging data shows age-related changes in neural activity during response inhibition. While traditional methods of exploring neuroimaging data are limited to determining correlational relationships, newer methods can determine predictability and can begin to answer these questions. Therefore, the goal of the current study was to determine which aspects of neural function predict individual differences in age, inhibitory function, response speed, and response time variability. We administered a stop-signal task requiring rapid inhibition of ongoing motor responses to healthy participants aged 9-30. We conducted a standard analysis using GLM and a predictive analysis using high-dimensional regression methods. During successful response inhibition we found regions typically involved in motor control, such as the ACC and striatum, that were correlated with either age, response inhibition (as indexed by stop-signal reaction time; SSRT), response speed, or response time variability. However, when examining which variables neural data could predict, we found that age and SSRT, but not speed or variability of response execution, were predicted by neural activity during successful response inhibition. This predictive relationship provides novel evidence that developmental differences and individual differences in response inhibition are related specifically to inhibitory processes. More generally, this study demonstrates a new approach to identifying the neurocognitive bases of individual differences.

Keywords: development; fMRI; predictive analysis; response inhibition; stop-signal.


Figures

Figure 1
Figure 1
(A) Schematic of go trials and stop trials. (B) The race model of stopping (Logan and Cowan, 1984). All correct RTs were arranged in ascending order in an assumption-free distribution to calculate the RT at each participant's proportion of failed inhibition (quantileRT). SSRT could then be calculated as quantileRT – SSD. Figure adapted from Aron et al. (2006).
Figure 2
Figure 2
Depiction of the predictive methods used. (A) All subjects were randomly assigned to 1 of 4 groups in such a way as to balance the distribution of the target variable across groups. Cross-validation was used, meaning that 3 groups were used to train the classifier (in this case 1, 2 and 3, although all iterations were used) and the classifier predicted the label value for the 4th group. (B) To quantify the accuracy of the classifier, the correlation between the actual label value and the label value predicted by the classifier was computed. Higher correlations imply that the actual and predicted values were similar, and thus the classifier was successfully predictive.
Figure 3
Figure 3
Whole-brain main effects of (A) successful going – baseline, (B) successful stopping – successful going, and (C) successful stopping – unsuccessful stopping. All clusters survived whole-brain correction at z > 2.3, p < 0.05. For a list of clusters of activity, see Table 2.
Figure 4
Figure 4
Regions showing correlations between successful going vs. baseline and (A) median Go response time (GoRT) and (B) the standard deviation of Go response time (SDRT). All correlations were corrected at the whole-brain level at z > 2.3, p < 0.05. For cluster details, see Table 3.
Figure 5
Figure 5
Regions showing correlations between successful stopping vs. successful going and (A) age, (B) SSRT, (C) median Go response time (GoRT) and (D) the standard deviation of Go response time (SDRT). All correlations were corrected at the whole-brain level at z > 2.3, p < 0.05. For cluster details, see Table 4.
Figure 6
Figure 6
Correlations between actual label values for age, SSRT, GoRT, and SDRT and predicted label values for (A) successful go – baseline, (B) successful stop – successful go and (C) successful stop – unsuccessful stop. Correlations shown for all three methods of prediction: Gaussian process regression with a linear kernel (GPR linear), Gaussian process regression with a squared exponential kernel (GPR exp), and linear support vector machine (SVM) regression. Blue lines depict the 95th percentile of an empirical null distribution, whereas the error bars depict the 95% confidence interval of correlation values across cross-validation samples. Thus, the blue depicts the threshold for statistical significance against the null hypothesis of zero predictability, whereas the error bars depict the stability of the prediction estimates across samples. Note that only predicted age and SSRT label values during successful stop – successful go are significantly related to actual age and SSRT.
Figure 7
Figure 7
Sensitivity maps for predictability of (A) age and (B) SSRT from successful stop – successful go contrast. Units are regression weights from the linear Gaussian process regression classifier. Orange areas are those that positively predict the label value; blue areas are those that negatively predict the label value. The color bars indicate the scale for each contrast. It is important to note that these regions may reflect the sensitivity of a particular classifier and could potentially change with different classifiers.

References

    1. Aron A. R., Behrens T. E., Smith S., Frank M. J., Poldrack R. A. (2007). Triangulating a cognitive control network using diffusion-weighted magnetic resonance imaging (MRI) and functional MRI. J. Neurosci. 27, 3743–375210.1523/JNEUROSCI.0519-07.2007 - DOI - PMC - PubMed
    1. Aron A. R., Fletcher P. C., Bullmore E. T., Sahakian B. J., Robbins T. W. (2003). Stop-signal inhibition disrupted by damage to right inferior frontal gyrus in humans. Nat. Neurosci. 6, 115–11610.1038/nn1003 - DOI - PubMed
    1. Aron A. R., Poldrack R. A. (2006). Cortical and subcortical contributions to stop signal response inhibition: role of the subthalamic nucleus. J. Neurosci. 26, 2424–243310.1523/JNEUROSCI.4682-05.2006 - DOI - PMC - PubMed
    1. Band G. P., van der Molen M. W., Logan G. D. (2003). Horse-race model simulations of the stop-signal procedure. Acta Psychol. 112, 105–14210.1016/S0001-6918(02)00079-3 - DOI - PubMed
    1. Bellgrove M. A., Hester R., Garavan H. (2004). The functional neuroanatomical correlates of response variability: evidence from a response inhibition task. Neuropsychologia 42, 1910–191610.1016/j.neuropsychologia.2004.05.007 - DOI - PubMed