

Genome-wide meta-analysis for serum calcium identifies significantly associated SNPs near the calcium-sensing receptor (CASR) gene
- PMID: 20661308
- PMCID: PMC2908705
- DOI: 10.1371/journal.pgen.1001035
Genome-wide meta-analysis for serum calcium identifies significantly associated SNPs near the calcium-sensing receptor (CASR) gene
Abstract
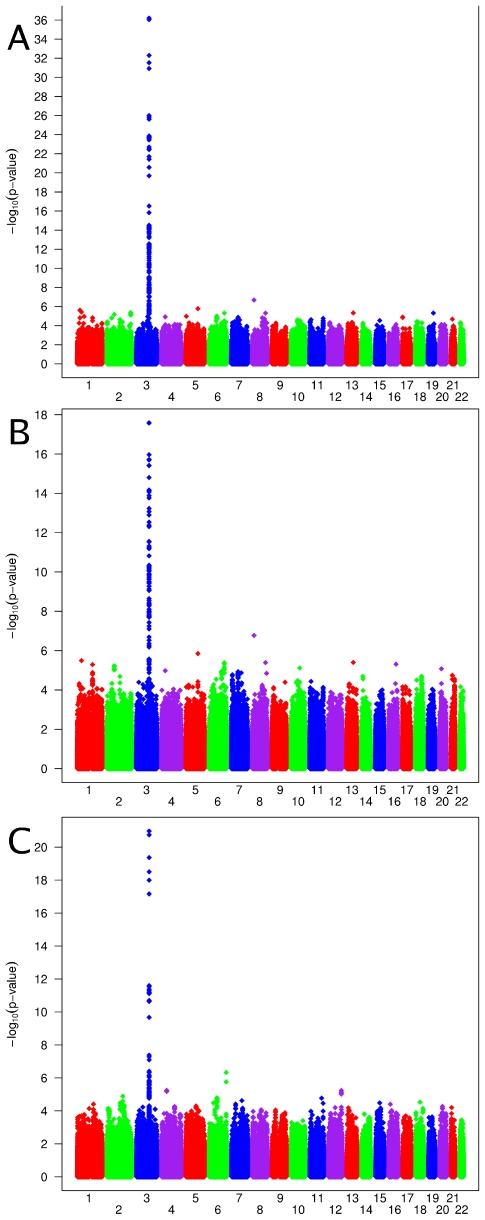
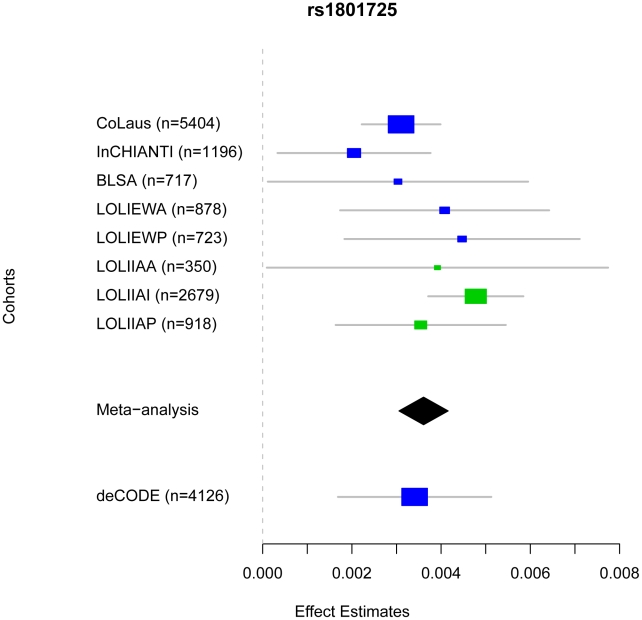
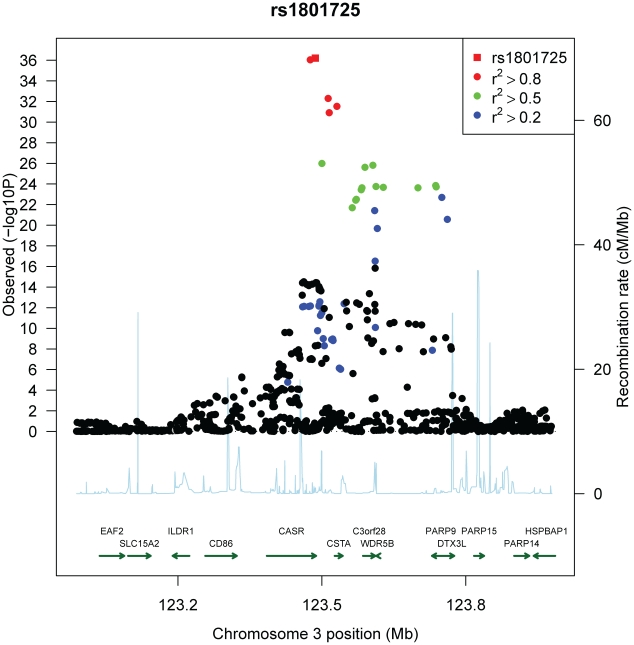
Calcium has a pivotal role in biological functions, and serum calcium levels have been associated with numerous disorders of bone and mineral metabolism, as well as with cardiovascular mortality. Here we report results from a genome-wide association study of serum calcium, integrating data from four independent cohorts including a total of 12,865 individuals of European and Indian Asian descent. Our meta-analysis shows that serum calcium is associated with SNPs in or near the calcium-sensing receptor (CASR) gene on 3q13. The top hit with a p-value of 6.3 x 10(-37) is rs1801725, a missense variant, explaining 1.26% of the variance in serum calcium. This SNP had the strongest association in individuals of European descent, while for individuals of Indian Asian descent the top hit was rs17251221 (p = 1.1 x 10(-21)), a SNP in strong linkage disequilibrium with rs1801725. The strongest locus in CASR was shown to replicate in an independent Icelandic cohort of 4,126 individuals (p = 1.02 x 10(-4)). This genome-wide meta-analysis shows that common CASR variants modulate serum calcium levels in the adult general population, which confirms previous results in some candidate gene studies of the CASR locus. This study highlights the key role of CASR in calcium regulation.
Conflict of interest statement
Vincent Mooser and Dawn Waterworth are full-time employees of GlaxoSmithKline, a pharmaceutical company. Peter Vollenweider and Gerard Waeber received financial support from GlaxoSmithKline to build the CoLaus study. Daniel F Gudbjarsson, Unnur Styrkarsdottir, Hilma Holm, Unnur Thorsteinsdottir and Kari Stefansson are employees of deCODE genetics, a biotechnology company.
Figures
References
-
- Carafoli E. Calcium-mediated cellular signals: a story of failures. Trends Biochem Sci. 2004;29:371–379. - PubMed
-
- Carafoli E. Calcium–a universal carrier of biological signals. Delivered on 3 July 2003 at the Special FEBS Meeting in Brussels. FEBS J. 2005;272:1073–1089. - PubMed
-
- Carafoli E. The ambivalent nature of the calcium signal. J Endocrinol Invest. 2004;27:134–136. - PubMed
-
- Whitfield JB, Martin NG. The effects of inheritance on constituents of plasma: a twin study on some biochemical variables. Ann Clin Biochem. 1984;21 (Pt 3):176–183. - PubMed
-
- Williams PD, Puddey IB, Martin NG, Beilin LJ. Platelet cytosolic free calcium concentration, total plasma calcium concentration and blood pressure in human twins: a genetic analysis. Clin Sci (Lond) 1992;82:493–504. - PubMed
Publication types
MeSH terms
Substances
Grants and funding
LinkOut - more resources
Full Text Sources
Other Literature Sources
