. 2010 Jul 22;6(7):e1001036.
doi: 10.1371/journal.pgen.1001036.

Microevolution of Helicobacter pylori during prolonged infection of single hosts and within families

Affiliations

Microevolution of Helicobacter pylori during prolonged infection of single hosts and within families

Giovanna Morelli et al. PLoS Genet. .

Abstract

Our understanding of basic evolutionary processes in bacteria is still very limited. For example, multiple recent dating estimates are based on a universal inter-species molecular clock rate, but that rate was calibrated using estimates of geological dates that are no longer accepted. We therefore estimated the short-term rates of mutation and recombination in Helicobacter pylori by sequencing an average of 39,300 bp in 78 gene fragments from 97 isolates. These isolates included 34 pairs of sequential samples, which were sampled at intervals of 0.25 to 10.2 years. They also included single isolates from 29 individuals (average age: 45 years) from 10 families. The accumulation of sequence diversity increased with time of separation in a clock-like manner in the sequential isolates. We used Approximate Bayesian Computation to estimate the rates of mutation, recombination, mean length of recombination tracts, and average diversity in those tracts. The estimates indicate that the short-term mutation rate is 1.4 x 10(-6) (serial isolates) to 4.5 x 10(-6) (family isolates) per nucleotide per year and that three times as many substitutions are introduced by recombination as by mutation. The long-term mutation rate over millennia is 5-17-fold lower, partly due to the removal of non-synonymous mutations due to purifying selection. Comparisons with the recent literature show that short-term mutation rates vary dramatically in different bacterial species and can span a range of several orders of magnitude.


Conflict of interest statement

The authors have declared that no competing interests exist.

Figures
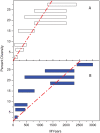
Figure 1
Figure 1. Percentage diversity in rRNA versus age (million years).
(A) original correlation by Ochman and Wilson . (B) lack of good correlation according to modern estimates of age ranges (Table 1).
Figure 2
Figure 2. Sequence differences for 78 gene fragments (X axis) that were tested from 34 pairs of sequential isolates (Y axis).
Of 2,650 pairs of sequenced gene fragments, 2,526 were identical (white), 62 differ by one polymorphism (green), 12 had two polymorphisms (red), and 50 had at least three (black). Two question marks indicate missing data that were not used for comparisons. Gene fragments are designated by their designations in the genome of 26695 (HPxxxx) , except that the first seven gene fragments that are used for MLST of H. pylori also include the gene designations.
Figure 3
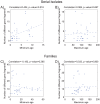
Figure 3. Age versus number of different gene fragments in pairwise comparisons.
(A,B) serial isolates. (C, D) isolates within each family. (A) Minimum age was the time separation between pairs of isolates. (B) Maximum age was the sum of the ages of the infected person upon isolation of the serial isolates. (C) Minimum age was the minimum age of the two subjects—20. (D) Maximum age was the sum of the ages of the two family members. Each plot contains a linear regression of the data, whose correlation (R) and probability (p) are indicated above the plot.
Figure 4
Figure 4. Pair-wise comparison of sequences from 29 isolates acquired from members of 10 families.
Of 2,568 sequenced gene fragments, 2,169 were identical (white), 183 had one difference (green), 30 had two differences (red), and 186 had at least four differences (black). Six question marks indicate missing data that were not used for comparisons.
Figure 5
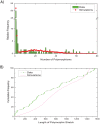
Figure 5. Comparisons of observed and simulated data for sequences from serial isolates.
(A) relative frequency of numbers of polymorphisms. (B) cumulative frequency of the lengths of polymorphic stretches. Comparable data for the family isolates are presented in Figure S2.

References

    1. Achtman M, Morelli G, Zhu P, Wirth T, Diehl I, et al. Microevolution and history of the plague bacillus, Yersinia pestis. Proc Natl Acad Sci (USA) 2004;101:17837–17842. - PMC - PubMed
    1. Roumagnac P, Weill F-X, Dolecek C, Baker S, Brisse S, et al. Evolutionary history of Salmonella Typhi. Science. 2006;314:1301–1304. - PMC - PubMed
    1. Nübel U, Roumagnac P, Feldkamp M, Song JH, Ko KS, et al. Frequent emergence and limited geographic dispersal of methicillin-resistant Staphylococcus aureus. Proc Natl Acad Sci (USA) 2008;105:14130–14135. - PMC - PubMed
    1. Sreevatsan S, Pan X, Stockbauer K, Connell ND, Kreiswirth BN, et al. Restricted structural gene polymorphism in the Mycobacterium tuberculosis complex indicates evolutionarily recent global dissemination. Proc Natl Acad Sci (U S A) 1997;94:9869–9874. - PMC - PubMed
    1. Pupo GM, Lan R, Reeves PR. Multiple independent origins of Shigella clones of Escherichia coli and convergent evolution of many of their characteristics. Proc Natl Acad Sci (U S A) 2000;97:10567–10572. - PMC - PubMed

Publication types