. 2010 Jul 22;6(7):e1001032.
doi: 10.1371/journal.pgen.1001032.

Rad3 decorates critical chromosomal domains with gammaH2A to protect genome integrity during S-Phase in fission yeast

Affiliations

Rad3 decorates critical chromosomal domains with gammaH2A to protect genome integrity during S-Phase in fission yeast

Sophie Rozenzhak et al. PLoS Genet. .

Abstract

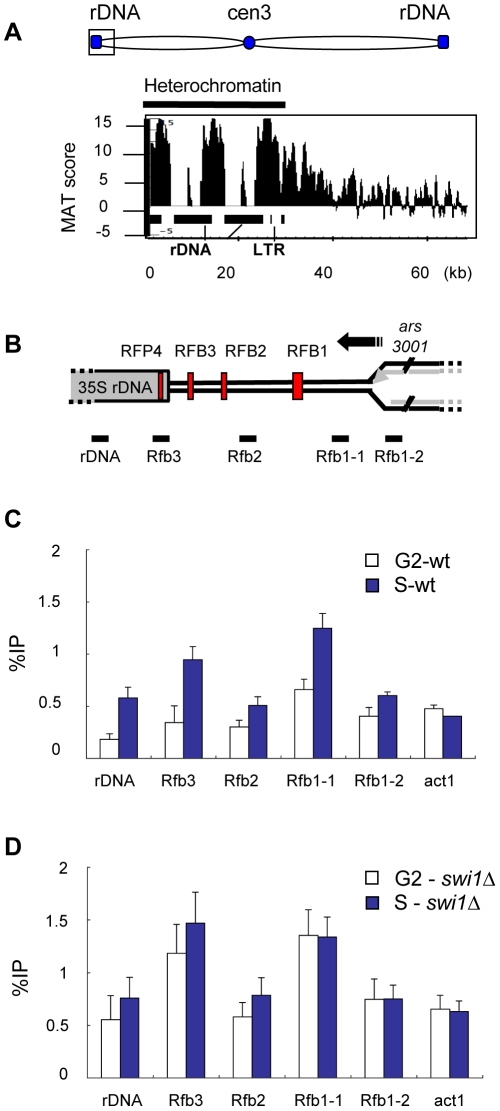
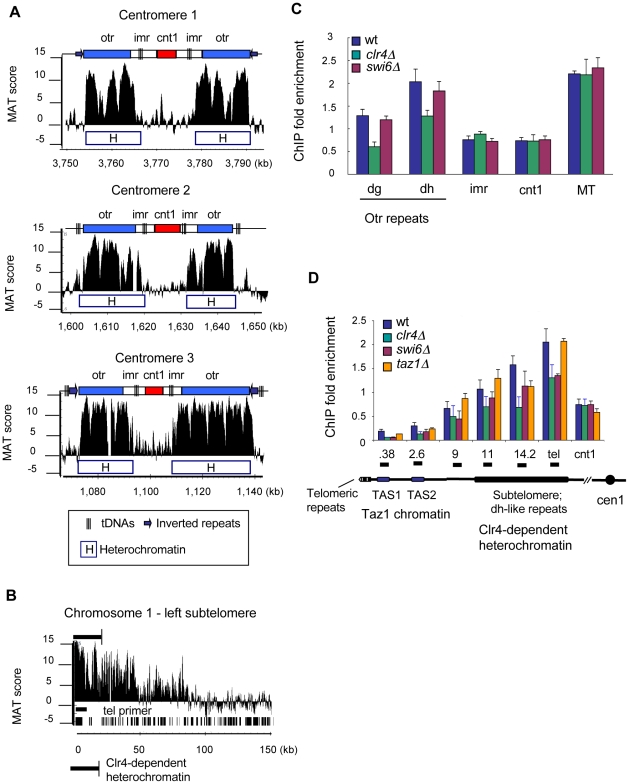
Schizosaccharomyces pombe Rad3 checkpoint kinase and its human ortholog ATR are essential for maintaining genome integrity in cells treated with genotoxins that damage DNA or arrest replication forks. Rad3 and ATR also function during unperturbed growth, although the events triggering their activation and their critical functions are largely unknown. Here, we use ChIP-on-chip analysis to map genomic loci decorated by phosphorylated histone H2A (gammaH2A), a Rad3 substrate that establishes a chromatin-based recruitment platform for Crb2 and Brc1 DNA repair/checkpoint proteins. Unexpectedly, gammaH2A marks a diverse array of genomic features during S-phase, including natural replication fork barriers and a fork breakage site, retrotransposons, heterochromatin in the centromeres and telomeres, and ribosomal RNA (rDNA) repeats. gammaH2A formation at the centromeres and telomeres is associated with heterochromatin establishment by Clr4 histone methyltransferase. We show that gammaH2A domains recruit Brc1, a factor involved in repair of damaged replication forks. Brc1 C-terminal BRCT domain binding to gammaH2A is crucial in the absence of Rqh1(Sgs1), a RecQ DNA helicase required for rDNA maintenance whose human homologs are mutated in patients with Werner, Bloom, and Rothmund-Thomson syndromes that are characterized by cancer-predisposition or accelerated aging. We conclude that Rad3 phosphorylates histone H2A to mobilize Brc1 to critical genomic domains during S-phase, and this pathway functions in parallel with Rqh1 DNA helicase in maintaining genome integrity.


Conflict of interest statement

The authors have declared that no competing interests exist.

Figures

Figure 1
Figure 1. γH2A forms in the mating-type locus during DNA replication.
(A) Diagram of a typical S. pombe mating-type (MT) locus (not to scale). Symbols: cen2 –centromere2, RTS1-polar replication fork barrier, DSB- imprinting site where DSB forms during replication; purple arrows - inverted repeats. Primer names correspond to distance in kilobases from the DSB. (B) ChIP-qPCR analysis of γH2A distribution at the MT locus in G2 and S phase. Cells were synchronized in G2 phase using the cdc25-22 allele and S-phase progression was monitored using septation index. ChIP enrichment at the indicated sites was quantitated %IP.
Figure 2
Figure 2. Genome-wide localization of γH2A during DNA replication.
(A) Genome-wide (ChIP-on-chip) distribution of γH2A during S phase. Schematics represent the three S. pombe chromosomes with key structural features (top). Tel- telomere; cen-centromere; MT-mating-type locus; rDNA-ribosomal DNA. Enrichment of γH2A is displayed as MAT scores (y-axis). Chromosome coordinates (x-axis, in megabases, (Mb)) downloaded from the S.pombe Genome Project (Sanger Center: www.sanger.ac.uk/Projects/S_pombe). (B) (left) γH2A formation occurs specifically during S phase. ChIP-qPCR timecourse analysis of γH2A enrichment at the indicated sites was performed by synchronizing cells using cdc25-22 block and release, and ChIP samples were collected every 30 min. Cell cycle progression was monitored by septation index. (right) Western blots comparing levels of γH2A in cdc25-22 wild type (Cds1+) and cdc25-22 cds1Δ cells released into 12 mM HU from G2 arrest. As an untreated control cdc25-22 wild type cells were released from G2 in the absence of HU. (C) Rad3 is the main kinase that phosphorylates H2A during unperturbed S phase. γH2AChIP-qPCR in wild type, rad3Δ, or tel1Δ cells synchronized as in (B), samples were collected in G2 and S phase. Primers: MT–5 kb from DSB in MT-locus; tel-subtelomere 1; cen-dh – centromere dh repeats; cnt – centromere 1 core; rDNA- 35S ribosomal DNA gene.
Figure 3
Figure 3. The RTS1 fork barrier at the MT locus triggers γH2A formation.
(A) Detailed landscape of γH2A in the MT locus as determined by ChIP-on-chip analysis in Figure 2A. The top diagram compares the MT locus configuration of the Donorless ChIP strain to sequences present on the Affymetrix S. pombe Tiling 1.0 FR microarray. Locations of key features correspond to the ChIP-on-chip data coordinates shown below. Both strains contain the RTS1 barrier. The ChIP strain is mating-type h+ at mat1, and lacks the silent donor alleles, which were replaced with a Leu2 marker. The microarray strain is mating-type h- at mat1 and contains only the mat3-h- donor allele. Both strains contain inverted repeat (IR) elements flanking the Leu2 or mat3 cassettes (purple arrows). Black rectangles below plot represent genes. Black boxes correspond to magnified regions shown in (B) and (C). (B) An example of preferential enrichment of γH2A in gene coding regions. (C) Detailed examination of γH2A at the IR boundary elements shows that γH2A spreading is restricted by B-box sequences (black triangles). (D) The RTS1 fork barrier leads to γH2A in the absence of the DSB. γH2A ChIP was performed in wild type and smt0 strains synchronized by cdc25-22 block. Diagram shows qPCR primer locations (black rectangles) relative to the DSB at Mat1. (E) γH2A formation at the MT-locus depends on Swi1-Swi3. γH2A ChIP was performed in the indicated strains as in (D) The locations of qPCR primers are indicated in diagram in (D).
Figure 4
Figure 4. γH2A forms at an ectopic RTS1 replication fork barrier.
(A) Diagram illustrates position of RTS1 barrier located between two direct repeats of Ade6 alleles. Diagram based on . (B) γH2A ChIP at sites surrounding the active or inactive RTS1 fork barrier. ChIP was performed on asynchronous cultures. A primer –3 kb from the RTS1 barrier in the MT locus was used as positive control.
Figure 5
Figure 5. γH2A is highly enriched in the rDNA repeats during S phase.
(A) Detailed ChIP-on-chip distribution of γH2A in the rDNA on the left arm of chromosome 3. Black rectangles (below graph) represent 35S rDNA gene repeats. (B) Diagram of one rDNA repeat (not to scale) shows the location of the four replication fork barriers (red vertical bars) relative to the 35S rDNA genes, the direction of replication (black arrow) from the ars3001 replication origin, and qPCR primer locations, below graph. (C, D) γH2A ChIP at the rDNA was performed in wild type and swi1Δ strains synchronized by cdc25-22 block and analyzed by qPCR with the indicated primers.
Figure 6
Figure 6. γH2A accumulates near tDNAs in the absence of Swi1.
(A) Detailed ChIP-on-chip distribution of γH2A near tDNA clusters bordering centromere 2. Boxed diagram above plot shows locations of centromere features: otr- outer repeats, imr- inner repeats, cnt – centromere core. Black boxes below plot represent genes. Location of qPCR primers are shown below graph and name correspond to distance from tDNATYR (B) ChIP-qPCR of γH2A near tDNATYR in wild type and swi1Δ cells.
Figure 7
Figure 7. γH2A in the centromeres and telomeres is associated with Clr4-dependent heterochromatin.
(A) Detailed ChIP-on-chip distribution of γH2A at the centromeres. Diagrams above each plot indicate key centromere features: otr – outer centromere dg/dh repeats; imr- inner repeats; cnt –centromere core. (B) Detailed ChIP-on-chip distribution of γH2A in the subtelomere of Chromosome 1. Location of genes and “tel” qPCR primer is shown as black bars below plot. (C) γH2A levels were reduced at the centromeres in clr4Δ cells. γH2A ChIP was performed in indicated strains synchronized by cdc25-22 block. The dg and dh primers are located in the outer centromere repeats. ChIP data is shown as Fold Enrichment, which was calculated relative to the act1 gene. (D) γH2A domain in the subtelomeres colocalizes with heterochromatin and decreases in clr4Δ and swi6Δ cells. ChIP was performed as in (C). Diagram below graph shows the organizational structure of the telomeres (not to scale) and was based on . Primer locations are marked by horizontal black bars (top) and correspond to distance in kilobases from the telomeric repeats.
Figure 8
Figure 8. Brc1 recruitment to γH2A sites is partially dependent on Clr4.
(A) Spontaneous Brc1-GFP foci are reduced in clr4Δ mutants. Live cell microscopy of Brc1-GFP overexpressed using the nmt promoter in wild type, htaAQ, and clr4Δ cells. There is no foci formation in the htaAQ mutant. Graph shows quantitated foci in the indicated strains. (B) Brc1 binds at γH2A sites, and Brc1 association with the telomeres and centromeres is reduced in clr4Δ mutants. ChIP to sites of Brc1-GFP overexpressed from the nmt promoter at γH2A-sites in the indicated strains. Cell cultures were asynchronous. Primer locations were described in Figure 2C and Figure 5B.
Figure 9
Figure 9. γH2A-Brc1 interactions are crucial for genome stability during unperturbed growth in the absence of Rqh1.
(A) Genetic interactions of rqh1Δ mutant with htaAQ, brc1Δ, and brc1-T672A. Five-fold serial dilutions of indicated strains were spotted on YES medium or YES with 2 mM HU and 1 µM CPT. Pictures were taken after 3 days at 30°C. (B) Tetrad dissection of brc1-T672A mutant crossed with rqh1Δ showing two dissected asci. The double mutant (pentagon) has strong synthetic growth defects compared to either parental strain. (C) The loss of Rqh1 function in the htaAQ, brc1Δ, or brc1-T672A mutants leads to cell elongation, chromosome segregations defects and higher levels of aberrant mitosis (indicates by arrows) compared to the individual parental strains. The indicated strains were grown in YES media at 30°C, cells were fixed in cold 70% ethanol, stained with DAPI, and analyzed by fluorescence microscopy. (D) Quantification of (C), error bars represent the range between independent duplicate experiments. (E) γH2A levels increase at the rDNA in the absence of Rqh1. γH2A ChIP was performed in the indicated strains. Primer locations are shown in Figure 5B.

References

    1. Aguilera A, Gomez-Gonzalez B. Genome instability: a mechanistic view of its causes and consequences. Nat Rev Genet. 2008;9:204–217. - PubMed
    1. Boddy MN, Russell P. DNA replication checkpoint. Curr Biol. 2001;11:R953–956. - PubMed
    1. Cimprich KA, Cortez D. ATR: an essential regulator of genome integrity. Nat Rev Mol Cell Biol. 2008;9:616–627. - PMC - PubMed
    1. Mirkin E, Mirkin S. Replication fork stalling at natural impediments. Microbiol and Mol Biol Rev. 2007;71:13–35. - PMC - PubMed
    1. Pearson C, Nichol Edamura K, Cleary J. Repeat instability: mechanisms of dynamic mutations. Nat Rev Genet. 2005;6:729–742. - PubMed

Publication types

MeSH terms