. 2010 Jul 2:4:28.
doi: 10.3389/fnsys.2010.00028. eCollection 2010.

Six principles of visual cortical dynamics

Affiliations

Six principles of visual cortical dynamics

Per E Roland. Front Syst Neurosci. .

Abstract

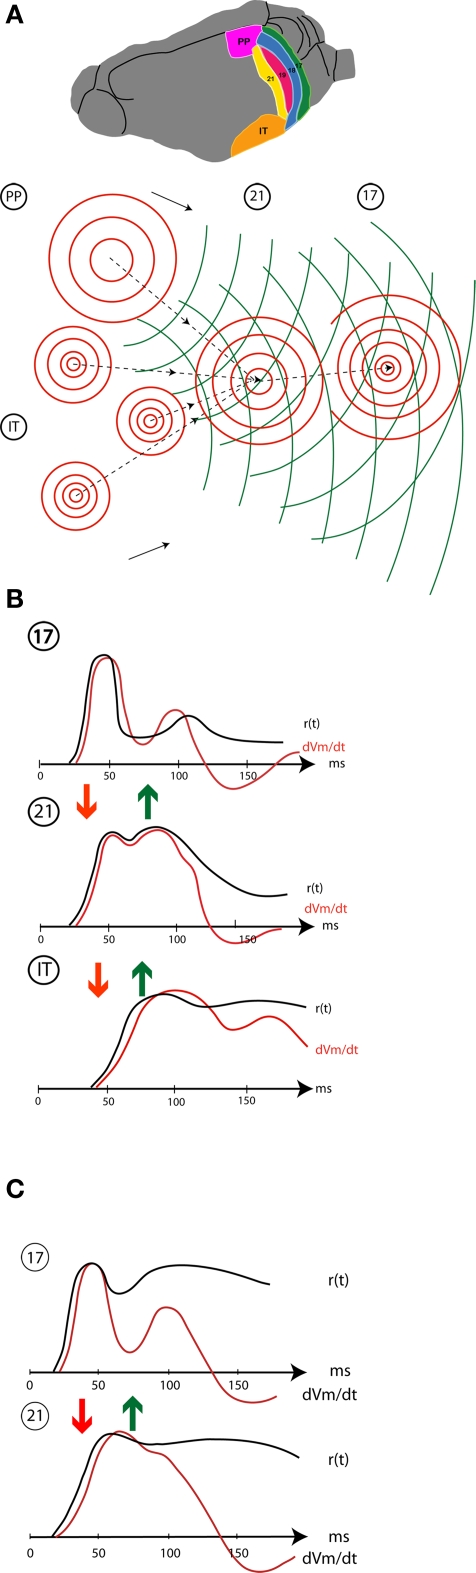
A fundamental goal in vision science is to determine how many neurons in how many areas are required to compute a coherent interpretation of the visual scene. Here I propose six principles of cortical dynamics of visual processing in the first 150 ms following the appearance of a visual stimulus. Fast synaptic communication between neurons depends on the driving neurons and the biophysical history and driving forces of the target neurons. Under these constraints, the retina communicates changes in the field of view driving large populations of neurons in visual areas into a dynamic sequence of feed-forward communication and integration of the inward current of the change signal into the dendrites of higher order area neurons (30-70 ms). Simultaneously an even larger number of neurons within each area receiving feed-forward input are pre-excited to sub-threshold levels. The higher order area neurons communicate the results of their computations as feedback adding inward current to the excited and pre-excited neurons in lower areas. This feedback reconciles computational differences between higher and lower areas (75-120 ms). This brings the lower area neurons into a new dynamic regime characterized by reduced driving forces and sparse firing reflecting the visual areas interpretation of the current scene (140 ms). The population membrane potentials and net-inward/outward currents and firing are well behaved at the mesoscopic scale, such that the decoding in retinotopic cortical space shows the visual areas' interpretation of the current scene. These dynamics have plausible biophysical explanations. The principles are theoretical, predictive, supported by recent experiments and easily lend themselves to experimental tests or computational modeling.

Keywords: cortical theory; feedback; inter-area communication; laminar firing; membrane potential; object motion; object vision; voltage-sensitive dyes.


Figures

Figure 1
Figure 1
Cartoon of a cylindrical volume of the visual cortex illustrating the extensive spread and overlap of dendrites and axons. Diameter of large cylinder 600 μm, diameter of small cylinder 50 μm. The small cylinder will contain dendrites from approximately 75000 neurons.
Figure 2
Figure 2
Neurons in the parietal cortex and area SSY of the ferret are in an up-state and send two FBs to lower order areas 249. 8–268 ms and 317.9–340.0 ms. Measurement of spontaneous ongoing relative population membrane potentials (measured with the voltage-sensitive dye RH 1838) in areas SSY, 21, 19, 18, and 17 of the ferret. The anatomically reconstructed cytoarchitectural borders shown in magenta overlaying the cortex. Scale: relative membrane potential in fraction of maximum. TEMP temporal lobe localization, PAR parietal lobe localization.
Figure 3
Figure 3
The image decoded by the area 17 neurons changes over time. (A) The left pattern was shown. At time 0 ms the pattern shifted to the right pattern. (B) The mean r(t) in Hz of the area 17 neurons mapping the new pattern (average of five animals). (C) The old pattern (left), the difference between the old pattern and the new pattern (middle), the new pattern (right). (D) The average correlation between the old, the difference pattern and the new pattern and the r(t) of area 17 mapping neurons. Note that, corresponding to the ON response induced by the change to the new pattern, the neurons are mostly correlated with the difference between the old and the new pattern. After 90 ms the neurons code mostly for the current pattern. (Modified from Eriksson et al., 2010).
Figure 4
Figure 4
The increase and reduction in dimensionality at the mapping site of the object in visual area 17 after introduction of a stationary object at time 0. COR correlation in r(t) between pairs of neurons (Smith and Kohn, 2008). Vm population membrane voltage. VAR (yellow) variance of the population membrane potential (calculated from Roland et al., 2006); VAR (green) trial-by-trial variance in the firing rate (Gawne et al., 1996); r(t) firing rate; dV/dt time derivative of membrane potential V (proportional to net membrane current); (Eriksson et al., 2008). As the variance decrease and the correlations increase in the feedback interval the dimensionality reduces. All data normalized to maximum values.
Figure 5
Figure 5
Schematic display of spatio-temporal dynamics of the population firing rates, r(t), membrane potentials and population dVm/dt (net membrane current) in areas 17,21,and visual temporal cortex (IT). (A) occipital, temporal, and parietal (PP) visual areas in the ferret showing the mapping and lateral spreading excitation (red) in response to a small stationary object appearing in the field of view. The object is mapped once in the retinotopically organized areas 17 (18, 19 not shown) 21, and PP, but several places in IT (non-retinotopic). The focused excitatory FB shown by stippled curves with arrows and the broad FB propagation is shown in green. (B) Stationary object appearing at time 0: temporal dynamics of the population firing rates and the dVm/dt at the mapping sites in areas 17, 21, and IT. Initially the local r(t) drives the dVm/dt (based on Salazar et al., ; Eriksson et al., ; Roland unpublished; Chen et al., 2007). (C) Moving object: r(t) and dVm/dt at the initial mapping sites in areas 17 and 21 (modified after Harvey et al., 2009). Arrows show the communication directions (FF red, FB green).
Figure 6
Figure 6
Spatio-temporal dynamics of the dVm/dt in response to a stationary object appearing at time 0 ms. Note the large bump mapping the object at the area 17/18 border, the smaller emerging bump at the area 19/21 border 39.5 and 46.1 ms) and the lateral spreading excitation from the center of both bumps, the FB 61.4–78.6 ms, the lateral spreading inhibition (negative dVm/dt) spreading out first from the 17/18 mapping site and then from the 19/21 area mapping site 91.5 ms to 112.9 ms.
Figure 7
Figure 7
Spatio-temporal dynamics snapshots of the dVm/dt in response to a moving bar 1 × 2°. (A) Appearing in the center of field of view at time 0 ms. Note the FF excitation establishing a moving bump at the area 19/21 border, the lateral spreading excitation from both mapping sites, the FB directed towards the cortical direction of motion 65.7–84.1 ms and the resulting excitation in the direction of cortical motion along the 17/18 border 96.4 ms, the lateral inhibition spreading behind the excitations mapping the moving object 108.6–127 ms. (B) Moving object appearing 10.5° from the center in the peripheral field of view. The mapping of the moving object enters the measurement area at 86.9 ms. FB from the 19/21 mapping site towards the 17/18 mapping site 99.8–118 ms, computation of an excitation in the cortical direction of motion 148.9 ms, progress towards the cortical zone mapping the center of field of view 317–334.8 ms associated with a new FF excitation towards the 19/21 border. As the object moves on the lateral spreading inhibition appears at the sites where the object was mapped along the 17/18 cytoarchitectural border.
Figure 8
Figure 8
The feedback to the appearance a small stationary luminance defined square. (A) Three-dimensional display of the top of the FB excitation moving from parietal and temporal visual areas via areas 21, 19, and 18 to area 17. Time in milliseconds after the appearance of the square. Right: The FB in interaction with the mapping neurons in areas 17/18 segments the square from its background at 103 ms. (B) From the left: The neurons in areas 17 and 18 mapping the object background fire significantly when the square is introduced (multiunit activity). The electrode penetration sites in relation to the segmentation of the square from its background in 11 animals. The multiunit activity of neurons mapping the square (standard errors of mean shown). Neurons firing statistically significantly in the cortex mapping the object background between the mapping site at the area 19/21 border and the site in area 17. Note the statistically significant firing at the time the FB passes 86–96 ms and the following significant decrease in the firing rate (modified from Roland et al., 2006).
Figure 9
Figure 9
Laminar firing at the mapping sites in area 17 and 21 of a stationary square appearing at 0 ms. (A) Six visual areas of the ferret. (B) Post stimulus histogram from 16 leads. Note the difference in latencies between laminae and the longer latencies to peak in area 21. Note also the larger amplitude of the r(t) and earlier peak to the FB from higher order areas at 80 ms in area 21 compared to the second peak in area 17 (100 ms).
Figure 10
Figure 10
Laminar firing to a small bar moving downwards along the vertical meridian at three different positions along the cytoarchitectural border between areas 17 and 18 mapping the vertical meridian. (A) The moving bar was introduced moving from the center of field of view. From the top laminar post stimulus histogram from 16 leads across the cortex at the point mapping the center of field of view showing the latency differences. At 420 μm, i.e., 85 ms after the appearance the neurons in the upper layers fire first. At 980 μm, i.e., at 195 ms and after the FB the infra-granular neurons lead the onset of firing. (B) Current source density at the center cortical point with the onset latencies of the laminar onsets of firing (from M. Harvey, unpublished material from experiments described in Harvey et al., 2009).
Figure 11
Figure 11
Cortical spatio-temporal dynamics of the apparent motion illusion. (A) A square is shown to the ferret in quick succession in two positions in the field of view, giving the illusion of apparent motion in humans. (B) The square is mapped as increases in dVm/dt in the cortex at two distinct positions at the 17/18 area border 44.2 and 124.6 ms. (C) At 112 ms a FB from areas 19/21 exciting the neurons on the way back to area 17, then turning and exciting and firing the neurons in the space in-between the mappings at the 17/18 border. (D) After this the excitation of areas 17, 18, 19, and 21 progress over the cortex in phase. (E) the transverse excitation (dVm/dt) induced by the FB and the r(t) in between the stationary mappings. Average of 10 animals with S.E.M. (F) Firing of a multiunit at the 17/81 border between the stationary object mappings to the control (only one object flashed at the time at the corresponding positions) and during apparent motion (AM). (G) Mean difference between the r(t) in 10 animals between the apparent motion condition and the sum of r(t) in the control conditions (top). Bottom: units firing significantly more APs in apparent motion condition, but only just after the FB to area 17 and only in between the object mappings shown in B. (H) Cartoon of visual areas 17, 18, 19, and 21 with the mappings of the bottom and top square (A) in the time interval 100–140 ms. Note that the higher order areas 19/21 in the apparent motion case enslave areas 17/18 to compute (apparent) object motion out of objects initially mapped as stationary objects by the 17/18 neurons (modified from Ahmed et al., 2008).
None

Similar articles

Cited by

References

    1. Ahmed B., Hanazawa A., Undeman C., Eriksson D., Valentiniene S., Roland P. E. (2008). Cortical dynamics subserving visual apparent motion. Cereb. Cortex 18, 2796–281010.1093/cercor/bhn038 - DOI - PMC - PubMed
    1. Akrami A., Liu Y., Treves A., Jagadeesh B. (2009). Converging neuronal activity in inferior temporal cortex during the classification of morphed stimuli. Cereb. Cortex 19, 760–77610.1093/cercor/bhn125 - DOI - PMC - PubMed
    1. Anderson J. C., Martin K. A. C. (2002). Connection from cortical area V2 to MT in macaque monkey. J. Comp. Neurol. 443, 56–7010.1002/cne.10100 - DOI - PubMed
    1. Angelucci A., Levitt J. B., Walton J. S., Hupé J.-M., Bullier J., Lund J. S. (2002). Circuits for local, and globalö signal integration in primary visual cortex. J. Neurosci. 22, 8633–8646 - PMC - PubMed
    1. Arieli A., Shoham D., Hildesheim R., Grinvald A. (1995). Coherent spatiotemporal patterns of ongoing activity revealed by real-time optical imaging coupled with single-unit recording in the cat visual cortex. J. Neurophysiol. 73, 2072–2093 - PubMed

LinkOut - more resources