. 2010 Oct;11(4):369-78.
doi: 10.1007/s10048-010-0252-7. Epub 2010 Jul 27.

Targeted disruption of the Mast syndrome gene SPG21 in mice impairs hind limb function and alters axon branching in cultured cortical neurons

Affiliations

Targeted disruption of the Mast syndrome gene SPG21 in mice impairs hind limb function and alters axon branching in cultured cortical neurons

Cynthia Soderblom et al. Neurogenetics. 2010 Oct.

Abstract

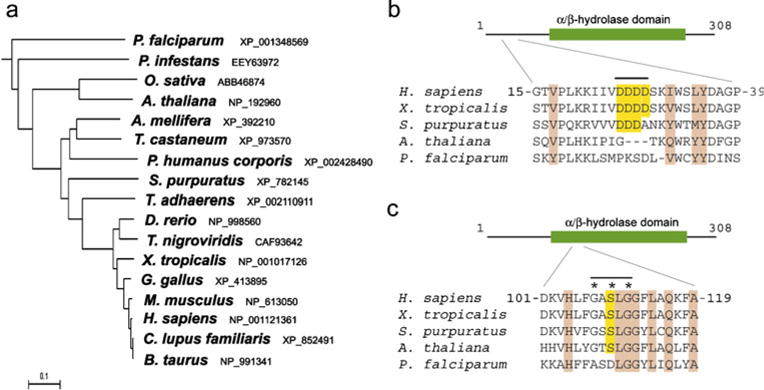
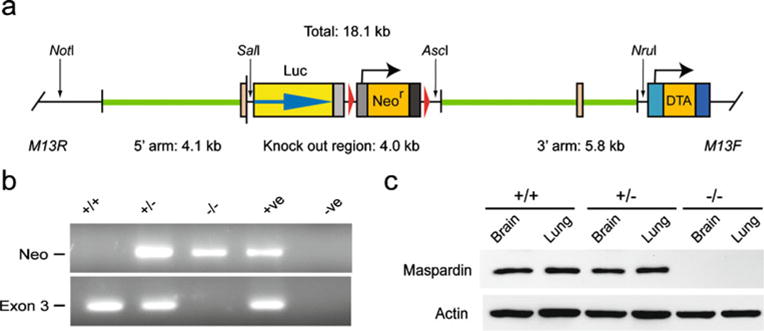
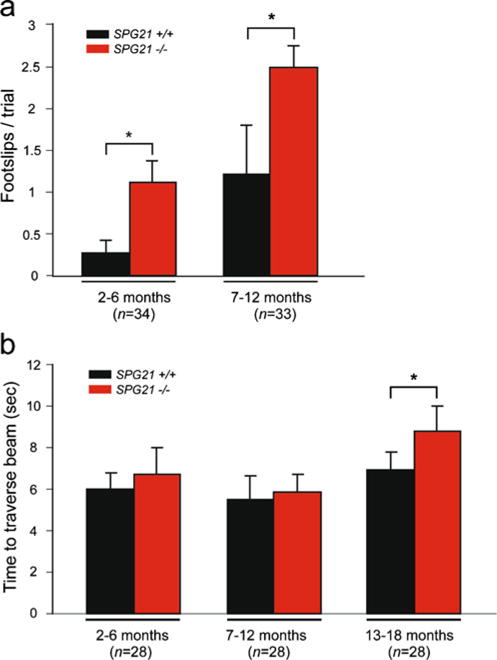
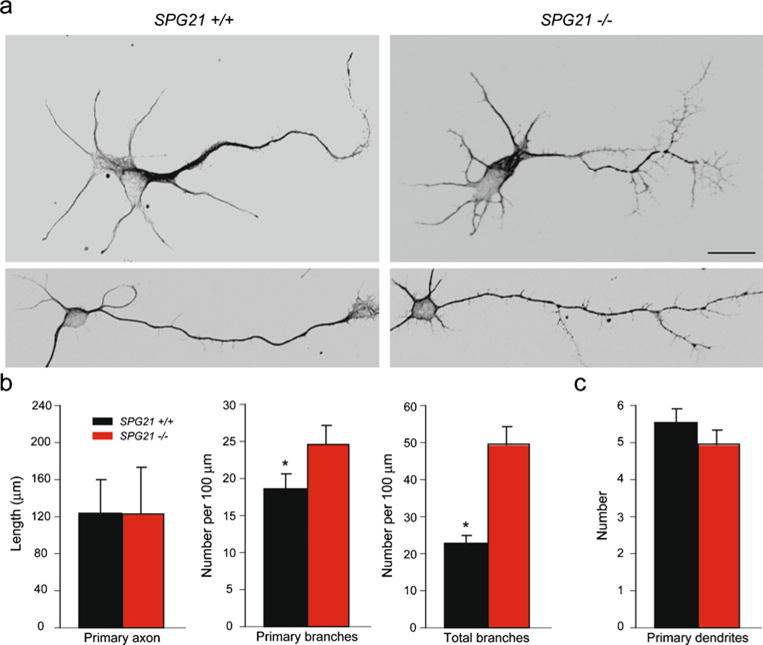
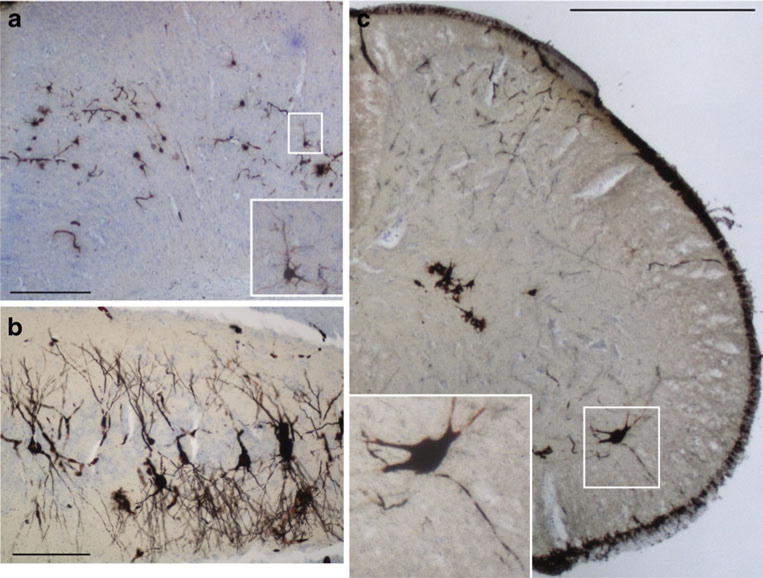
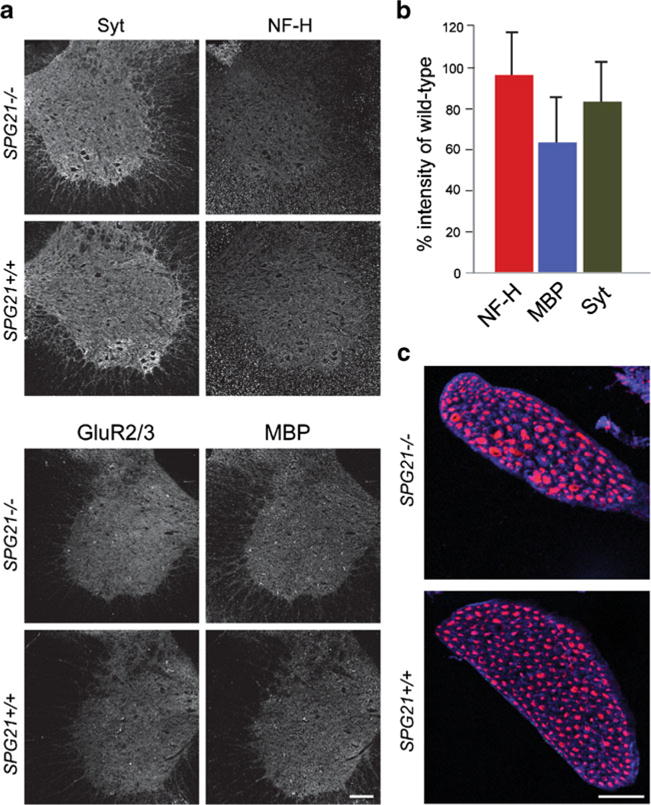
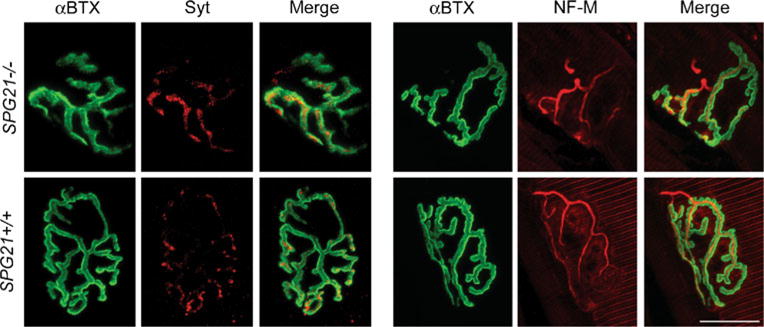
Mast syndrome (SPG21) is a childhood-onset, autosomal recessive, complicated form of hereditary spastic paraplegia (HSP) characterized by dementia, thin corpus callosum, white matter abnormalities, and cerebellar and extrapyramidal signs in addition to spastic paraparesis. A nucleotide insertion resulting in premature truncation of the SPG21 gene product maspardin underlies this disorder, likely leading to loss of protein function. In this study, we generated SPG21-/- knockout mice by homologous recombination as a possible animal model for SPG21. Though SPG21-/- mice appeared normal at birth, within several months they developed gradually progressive hind limb dysfunction. Cerebral cortical neurons cultured from SPG21-/- mice exhibited significantly more axonal branching than neurons from wild-type animals, while comprehensive neuropathological analysis of SPG21-/- mice did not reveal definitive abnormalities. Since alterations in axon branching have been seen in neurons derived from animal models of other forms of HSP as well as motor neuron diseases, this may represent a common cellular pathogenic theme.


Figures

Fig. 1
Fig. 1
Maspardin protein phylogeny. a Phylogenetic tree. Species and GenBank protein accession numbers are shown. The tree was constructed using ClustalW (v. 1.4). Scale bar indicates number of substitutions per site. b, c Sequence alignment of maspardin-related proteins from the indicated species. The acid cluster region is highlighted in yellow (b), and the G-X-S-X-G motif at nucelophile elbow is indicated by asterisks, with the Ser residue shaded in yellow (c). Conserved residues in all species shown are shaded light brown. A schematic diagram of human maspardin is shown at the top in b and c
Fig. 2
Fig. 2
Generation of SPG21−/− knockout mice. a Schematic representation of the SPG21 gene targeting strategy. DTA, diptheria toxia A subunit. b PCR analysis of SPG21+/+, SPG21+/− and SPG21−/− mice. c Immunoblot analysis of extracts (20 μg protein/lane) from the indicated tissues isolated from mice with the indicated SPG21 alleles. Actin levels were monitored as a control for protein loading
Fig. 3
Fig. 3
Narrow beam-walking analysis of SPG21−/− mice. a, b Mice of the indicated ages were subjected to the beam-walking test, and foot slips (a) and time to traverse (b) were recorded. Means ± S.D. are shown graphically; *p<0.05
Fig. 4
Fig. 4
Cerebral cortical neurons from SPG21−/− mice exhibit increased axon branching. a Representative neurons at 3 days in vitro were co-stained for β-tubulin and tau to identify neuronal processes. Scale bar, 20 μm. b, c Quantifications of primary axon length and number of total axon branches (b) as well as the number of dendrites per cell (c) are shown graphically (means ± S.D.; *p<0.05)
Fig. 5
Fig. 5
Light microscopic analysis of 40 μm thick Golgi- and Nissl-stained tissue sections from 12-month-old SPG21−/− mice. a Representative image of the cerebral motor cortex. The boxed area (enlarged in inset) shows a typical pyramidal neuron. No striking differences in neuronal morphology or layer organization were observed. Scale bar, 100 μm. b Representative image of the CA3 region of the hippocampus. Scale bar, 100 μm. c Representative image from the lumbar spinal cord. The boxed area (enlarged in inset) shows an α-motor neuron with projections. Scale bar, 500 μm
Fig. 6
Fig. 6
Light microscopic analysis of SPG21−/− mouse lumbar spinal cords. a Confocal images of spinal cord sections from 12-month-old mice stained for synaptotagmin I (Syt), neurofilament-H (NF-H), GluR2/3, and MBP. Scale bar, 100 μm. b Quantification of fluorescence intensity of markers for MBP, NF-H, and Syt in SPG21−/− mice expressed as a percentage of fluorescence found in tissue sections from wild-type SPG21 +/+ littermates (p>0.05, Student’s t test; n=4 for each marker). c Images of ventral roots stained for neurofilament-H (red) and MBP (blue). Scale bar, 50 μm
Fig. 7
Fig. 7
Light microscopic analysis of NMJs in 12-month-old SPG21−/− mice. Confocal immunofluorescence images of NMJs co-stained for neurofilament-M (NF-M) or synaptotagmin I (Syt; red) and α-bungarotoxin (αBTX; green). Cross-sectional areas and number of muscle fibers per NMJ were quantified in ImageJ but were not significantly different (p>0.05, Student’s t test; n=3). Two representative images are shown for each. Scale bar, 20 μm

References

    1. Harding AE. Classification of the hereditary ataxias and paraplegias. Lancet. 1983;1:1151–1155. - PubMed
    1. Salinas S, Proukakis C, Crosby A, Warner TT. Hereditary spastic paraplegia: clinical features and pathogenetic mechanisms. Lancet Neurol. 2008;7:1127–1138. - PubMed
    1. Reid E. Science in motion: common molecular pathological themes emerge in the hereditary spastic paraplegias. J Med Genet. 2003;40:81–86. - PMC - PubMed
    1. Fink JK. Hereditary spastic paraplegia. Curr Neurol Neurosci Rep. 2006;6:65–76. - PubMed
    1. Soderblom C, Blackstone C. Traffic accidents: molecular genetic insights into the pathogenesis of the hereditary spastic paraplegias. Pharmacol Ther. 2006;109:42–56. - PubMed

Publication types