. 2010 Sep;18(6):677-88.
doi: 10.1007/s10577-010-9147-6. Epub 2010 Jul 27.

Changes in chromatin structure during processing of wax-embedded tissue sections

Affiliations

Changes in chromatin structure during processing of wax-embedded tissue sections

Elizabeth Kerr et al. Chromosome Res. 2010 Sep.

Abstract

The use of immunofluorescence (IF) and fluorescence in situ hybridisation (FISH) underpins much of our understanding of how chromatin is organised in the nucleus. However, there has only recently been an appreciation that these types of study need to move away from cells grown in culture and towards an investigation of nuclear organisation in cells in situ in their normal tissue architecture. Such analyses, however, especially of archival clinical samples, often requires use of formalin-fixed paraffin wax-embedded tissue sections which need addition steps of processing prior to IF or FISH. Here we quantify the changes in nuclear and chromatin structure that may be caused by these additional processing steps. Treatments, especially the microwaving to reverse fixation, do significantly alter nuclear architecture and chromatin texture, and these must be considered when inferring the original organisation of the nucleus from data collected from wax-embedded tissue sections.


Figures

Fig. 1
Fig. 1
Alterations of nuclear size and shape during treatment of thyroid sections. a DAPI-stained 4-μm thyroid sections treated with xylene only (x), xylene + microwaving (xm), xylene + microwaving + protease (xmp) and as for FISH (xmpf), showing the positions of epithelial follicular cells (arrow) and parafollicular C cells (double-headed arrow). Bars = 10 μm; b box plots of nuclear diameter (micrometres) in x- or y-dimensions and nuclear shape (x/y) for C cells in sections treated with xylene only (x), xylene + microwaving (xm) or xylene + microwaving + protease (xmp). The boxed areas show the 25–75 percentiles and the medians are indicated by horizontal lines through these boxed areas. Statistically significant changes in nuclear size or shape between different treatments are indicated by asterisks (*p < 0.05 and >0.01; **p ≤ 0.01 and >0.001; ***p < 0.001). n = 10–20; c as in b, but for epithelial cells and including analysis of these cells as for FISH (xmpf). n = 22
Fig. 2
Fig. 2
Alterations of nuclear size and shape during treatment of breast sections. a DAPI-stained 6-μm breast sections treated with xylene only (x), xylene + microwaving (xm), xylene + microwaving + protease (xmp) and after FISH (xmpf), showing the position of basal (arrow) and luminal (double-headed arrow) epithelial cells. Bars = 10 μm; b box plots of nuclear diameter (micrometres) in x- or y-dimensions and nuclear shape (x/y) for basal epithelial cells in sections treated with xylene only (x), xylene + microwaving (xm), xylene + microwaving + protease (xmp) and as for fish (xmpf). The boxed areas show the 25–75 percentiles and the medians are indicated by horizontal lines through these boxed areas. Statistically significant changes in nuclear size or shape between different treatments are indicated by asterisks (*p < 0.05 and >0.01; **p ≤ 0.01 and >0.001; ***p < 0.001). n = 28; c as in b, but for luminal epithelial cells. n = 28
Fig. 3
Fig. 3
Visualisation of chromatin texture during tissue processing. a Grey-scale images of DAPI-stained nucleus from the luminal epithelium of normal mammary gland after xylene treatment to remove wax. Images are taken (i to xvi) at 0.25 μm intervals through the z-axis of the nucleus. Scale bar = 2 μm; b as in a but after image deconvolution to remove out-of-focus information; c single plane deconvolved images of DAPI-stained nuclei from luminal cells of the mammary gland epithelium after treatments with; xylene (x), xylene + microwaving (xm), xylene + microwaving + protease (xmp) and as for fish (xmpf). Scale bar = 2 μm; d as in c but with nuclei from the epithelium of the thyroid gland
Fig. 4
Fig. 4
Changes in the distribution of chromatin at the nuclear periphery during tissue processing. Histograms showing the mean (± SEM) percent of DAPI staining in each of five shells of equal area, eroded from the edge (shell 1) to the centre (shell 5) of the nucleus for; top row—basal (left) and luminal (right) breast epithelial cells, bottom row—thyroid epithelial cells, in tissue sections treated with xylene only (x, black bars), xylene + microwave (xm, dark grey bars), xylene + microwave + pepsin (xmp, light grey bars) and treated as for FISH (xmpf, white bars). n > 21
Fig. 5
Fig. 5
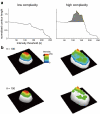
Contour length analysis as a measure of chromatin texture. a Graphs showing the relationship between the normalized chromatin contour length (contour length/nuclear contour) and increasing intensity threshold (θ) for examples of (left) rather homogeneous chromatin staining/low complexity and for (right) irregular chromatin texture/high complexity; b three-dimensional visualisation of the data in a for intensity thresholds set at 100 and 150. As in a, example images on the left are for low complexity chromatin texture and on the right for high complexity. Adapted from Kiyuna et al.
Fig. 6
Fig. 6
Chromatin contour complexity changes during tissue processing. Box plots showing the contour complexity for basal and luminal mammary epithelial cells (a) and thyroid follicular epithelial cells; b in sections treated with xylene only (x), xylene + microwaving (xm), xylene + microwaving + protease (xmp) and as for fish (xmpf). The boxed areas show the 25–75 percentiles and the medians are indicated by horizontal lines through these boxed areas. Statistically significant changes in nuclear size or shape between different treatments are indicated by asterisks (*p < 0.05 and >0.01; **p ≤ 0.01 and >0.001; ***p < 0.001). n ≥ 21; c histogram showing contour complexity (cc) normalized to nuclear size (xy) at each of the pre-treatment steps for epithelial cells of the thyroid (black bars) and basal (grey bars) or luminal (white bars) cells of the mammary epithelium

Similar articles

Cited by

References

    1. Barr ML, Bertram EG. A morphological distinction between neurones of the male and female, and the behaviour of the nucleolar satellite during accelerated nucleoprotein synthesis. Nature. 1949;163:676. doi: 10.1038/163676a0. - DOI - PubMed
    1. Bolzer A, Kreth G, Solovei I, Koehler D, Saracoglu K, Fauth C, Muller S, Eils R, Cremer C, Speicher MR, Cremer T. Three-dimensional maps of all chromosomes in human male fibroblast nuclei and prometaphase rosettes. PLoS Biol. 2005;3:e157. doi: 10.1371/journal.pbio.0030157. - DOI - PMC - PubMed
    1. Boyle S, Gilchrist S, Bridger JM, Mahy NL, Ellis JA, Bickmore WA. The spatial organization of human chromosomes within the nuclei of normal and emerin-mutant cells. Hum Mol Genet. 2001;10:211–219. doi: 10.1093/hmg/10.3.211. - DOI - PubMed
    1. Brown JM, Leach J, Reittie JE, Atzberger A, Lee-Prudhoe J, Wood WG, Higgs DR, Iborra FJ, Buckle VJ. Coregulated human globin genes are frequently in spatial proximity when active. J Cell Biol. 2006;172:177–187. doi: 10.1083/jcb.200507073. - DOI - PMC - PubMed
    1. Brown KE, Amoils S, Horn JM, Buckle VJ, Higgs DR, Merkenschlager M, Fisher AG. Expression of alpha- and beta-globin genes occurs within different nuclear domains in haemopoietic cells. Nat Cell Biol. 2001;3:602–606. doi: 10.1038/35078577. - DOI - PubMed

Publication types

LinkOut - more resources