. 2010 Aug;8(4):437-58.
doi: 10.1089/adt.2010.0281.

Characterization and optimization of a novel protein-protein interaction biosensor high-content screening assay to identify disruptors of the interactions between p53 and hDM2

Affiliations

Characterization and optimization of a novel protein-protein interaction biosensor high-content screening assay to identify disruptors of the interactions between p53 and hDM2

Drew D Dudgeon et al. Assay Drug Dev Technol. 2010 Aug.

Abstract

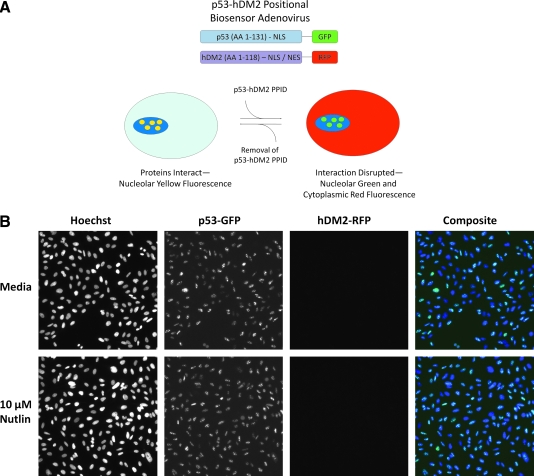
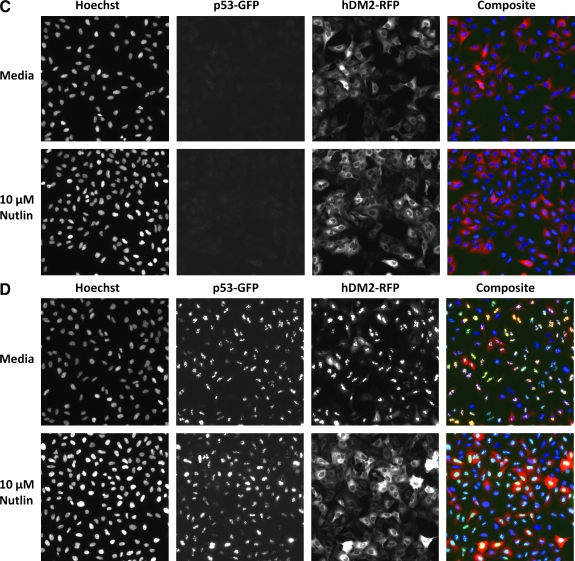
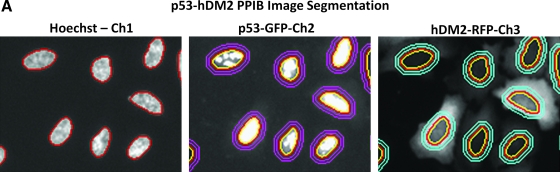
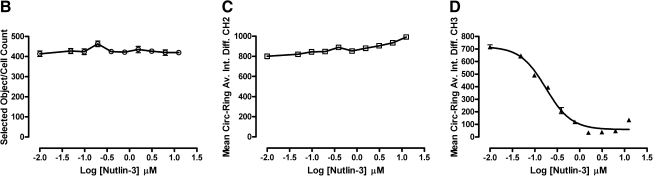
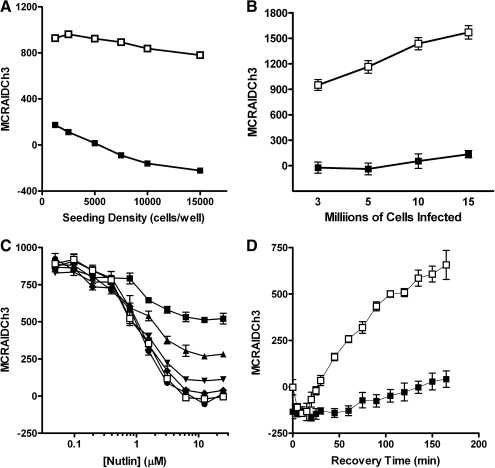
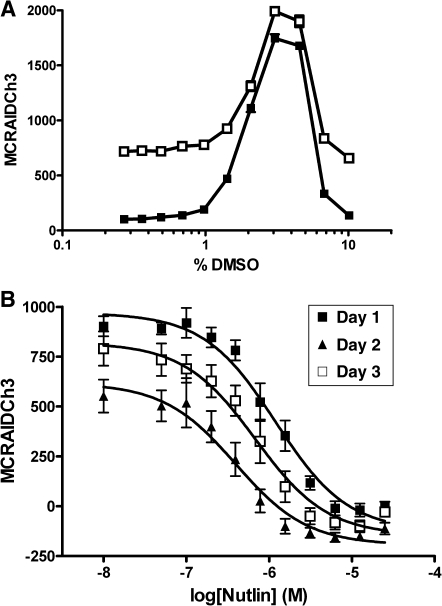
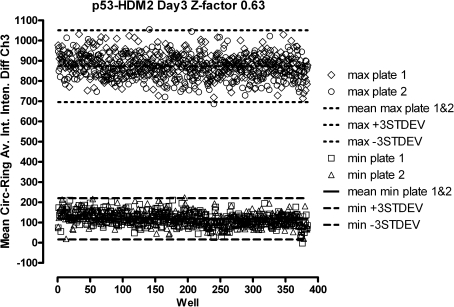
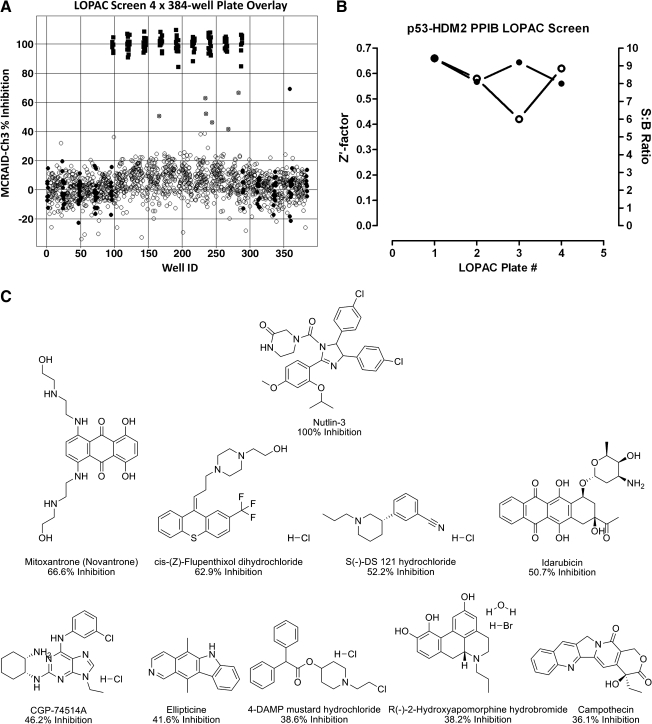
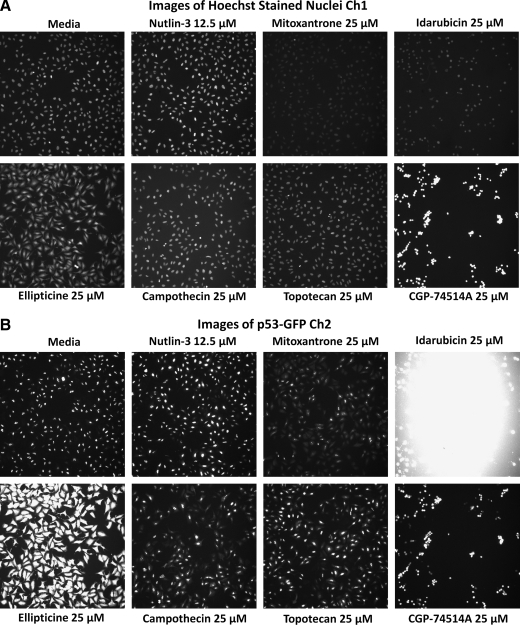
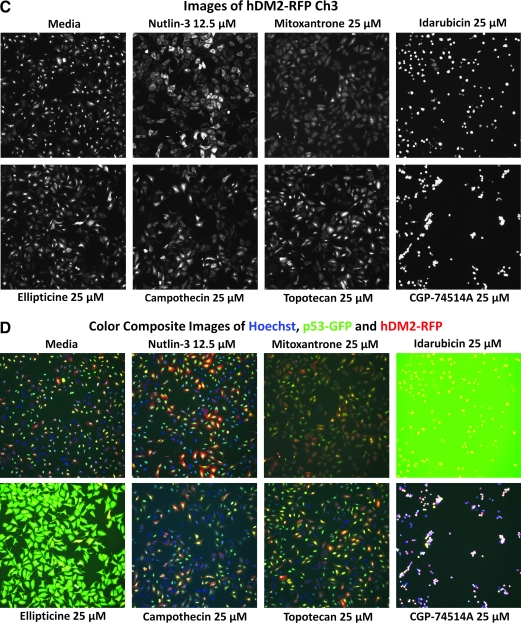
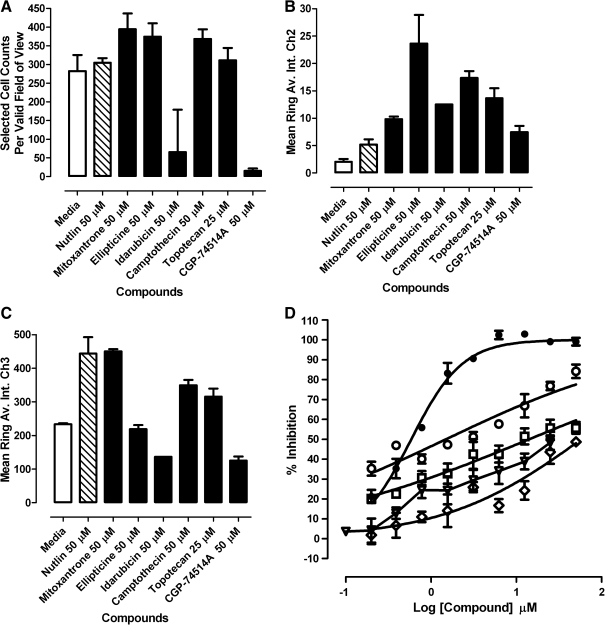
We present here the characterization and optimization of a novel imaging-based positional biosensor high-content screening (HCS) assay to identify disruptors of p53-hDM2 protein-protein interactions (PPIs). The chimeric proteins of the biosensor incorporated the N-terminal PPI domains of p53 and hDM2, protein targeting sequences (nuclear localization and nuclear export sequence), and fluorescent reporters, which when expressed in cells could be used to monitor p53-hDM2 PPIs through changes in the subcellular localization of the hDM2 component of the biosensor. Coinfection with the recombinant adenovirus biosensors was used to express the NH-terminal domains of p53 and hDM2, fused to green fluorescent protein and red fluorescent protein, respectively, in U-2 OS cells. We validated the p53-hDM2 PPI biosensor (PPIB) HCS assay with Nutlin-3, a compound that occupies the hydrophobic pocket on the surface of the N-terminus of hDM2 and blocks the binding interactions with the N-terminus of p53. Nutlin-3 disrupted the p53-hDM2 PPIB in a concentration-dependent manner and provided a robust, reproducible, and stable assay signal window that was compatible with HCS. The p53-hDM2 PPIB assay was readily implemented in HCS and we identified four (4) compounds in the 1,280-compound Library of Pharmacologically Active Compounds that activated the p53 signaling pathway and elicited biosensor signals that were clearly distinct from the responses of inactive compounds. Anthracycline (topoisomerase II inhibitors such as mitoxantrone and ellipticine) and camptothecin (topoisomerase I inhibitor) derivatives including topotecan induce DNA double strand breaks, which activate the p53 pathway through the ataxia telangiectasia mutated-checkpoint kinase 2 (ATM-CHK2) DNA damage response pathway. Although mitoxantrone, ellipticine, camptothecin, and topotecan all exhibited concentration-dependent disruption of the p53-hDM2 PPIB, they were much less potent than Nutlin-3. Further, their corresponding cellular images and quantitative HCS data did not completely match the Nutlin-3 phenotypic profile.


Figures

Fig. 1.
Fig. 1.
p53-hDM2 protein–protein interaction biosensor components, principle, and characterization. (A) Cartoon schematic of the protein–protein interaction partner components and the 2 interaction states of the p53-hDM2 positional biosensor. The p53-hDM2 protein–protein interaction biosensor design incorporates 2 recombinant adenovirus constructs driving expression of the N-terminal domains of the p53 and hDM2 interacting partners fused to fluorescent proteins (green fluorescent protein [GFP] or red fluorescent protein [RFP]) at their carboxy-terminus. The N-terminal residues 1–131 of p53 encompass the p53 transactivating domain that contains the binding site for hDM2 and is expressed as a GFP fusion protein that is targeted and anchored in the nucleolus of infected cells by the inclusion of a nuclear localization sequence (NLS). The N-terminal residues 1–118 of hDM2 encompass the binding site for the N-terminal transactivating domain of p53 and is expressed as an RFP fusion protein that includes both an NLS and a nuclear export sequence (NES). In U-2 OS cells that are coinfected with both adenovirus constructs the binding interactions between the hDM2 and p53 components of the biosensor resulted in both proteins becoming localized to the nucleolus, producing a yellow signal in composite images. Upon disruption of the p53-hDM2 protein–protein interaction with a compound such as Nutlin-3, the p53-GFP interaction partner remained nucleolar, while the shuttling hDM2-RFP interaction partner redistributed into the cytoplasm, and in the composite images of these cells, the nucleolus was predominantly light green/blue and the cytoplasm was predominantly red. (B–D) Individual gray-scale and 3-color composite images of U-2 OS cells from 3 fluorescent channels (Hoechst Ch1, GFP Ch2, and RFP Ch3) were sequentially acquired on the ArrayScan VTI platform using a 20 × 0.4 NA objective with the XF93 excitation and emission filter set (Hoechst, blue; FITC, green; and TRITC, red). U-2 OS cells were infected with (B) only the p53-GFP biosensor adenovirus, (C) only the hDM2-RFP biosensor adenovirus, or (D) both the p53-GFP and hDM2-RFP biosensor adenoviruses. Adenovirus-infected cells were seeded at 2,500 cells per well in 384-well Greiner collagen-coated assay plates, cultured overnight at 37°C, 5% CO2, and 95% humidity, and were then treated for 90 min with 0.5% dimethyl sulfoxide (DMSO) or 10 μM Nutlin-3 in 0.5% DMSO prior to fixation with 3.7% formaldehyde containing 2 μg/mL Hoechst 33342. Images from a single representative experiment of numerous experiments are presented.
Fig. 1.
Fig. 1.
p53-hDM2 protein–protein interaction biosensor components, principle, and characterization. (A) Cartoon schematic of the protein–protein interaction partner components and the 2 interaction states of the p53-hDM2 positional biosensor. The p53-hDM2 protein–protein interaction biosensor design incorporates 2 recombinant adenovirus constructs driving expression of the N-terminal domains of the p53 and hDM2 interacting partners fused to fluorescent proteins (green fluorescent protein [GFP] or red fluorescent protein [RFP]) at their carboxy-terminus. The N-terminal residues 1–131 of p53 encompass the p53 transactivating domain that contains the binding site for hDM2 and is expressed as a GFP fusion protein that is targeted and anchored in the nucleolus of infected cells by the inclusion of a nuclear localization sequence (NLS). The N-terminal residues 1–118 of hDM2 encompass the binding site for the N-terminal transactivating domain of p53 and is expressed as an RFP fusion protein that includes both an NLS and a nuclear export sequence (NES). In U-2 OS cells that are coinfected with both adenovirus constructs the binding interactions between the hDM2 and p53 components of the biosensor resulted in both proteins becoming localized to the nucleolus, producing a yellow signal in composite images. Upon disruption of the p53-hDM2 protein–protein interaction with a compound such as Nutlin-3, the p53-GFP interaction partner remained nucleolar, while the shuttling hDM2-RFP interaction partner redistributed into the cytoplasm, and in the composite images of these cells, the nucleolus was predominantly light green/blue and the cytoplasm was predominantly red. (B–D) Individual gray-scale and 3-color composite images of U-2 OS cells from 3 fluorescent channels (Hoechst Ch1, GFP Ch2, and RFP Ch3) were sequentially acquired on the ArrayScan VTI platform using a 20 × 0.4 NA objective with the XF93 excitation and emission filter set (Hoechst, blue; FITC, green; and TRITC, red). U-2 OS cells were infected with (B) only the p53-GFP biosensor adenovirus, (C) only the hDM2-RFP biosensor adenovirus, or (D) both the p53-GFP and hDM2-RFP biosensor adenoviruses. Adenovirus-infected cells were seeded at 2,500 cells per well in 384-well Greiner collagen-coated assay plates, cultured overnight at 37°C, 5% CO2, and 95% humidity, and were then treated for 90 min with 0.5% dimethyl sulfoxide (DMSO) or 10 μM Nutlin-3 in 0.5% DMSO prior to fixation with 3.7% formaldehyde containing 2 μg/mL Hoechst 33342. Images from a single representative experiment of numerous experiments are presented.
Fig. 2.
Fig. 2.
Molecular translocation image analysis algorithm. p53-hDM2 protein–protein interaction biosensor (PPIB) adenovirus-infected cells were seeded at 2,500 cells per well in 384-well Greiner collagen-coated assay plates, cultured overnight at 37°C, 5% CO2, and 95% humidity, and were then treated for 90 min with the indicated concentrations of Nutlin-3, mixed enantiomers, in 0.5% dimethyl sulfoxide prior to fixation with 3.7% formaldehyde containing 2 μg/mL Hoechst 33342. Images from 3 fluorescent channels were sequentially acquired on the ArrayScan VTI platform using a 20× 0.4 NA objective with the XF93 excitation and emission filter set and were analyzed with the molecular translocation (MT) image analysis algorithm. (A) Image segmentation. Hoechst-stained objects in Ch1 that exhibited the appropriate fluorescent intensities above background and size characteristics (width, length, and area) were identified and classified by the image segmentation as nuclei. The nuclear mask derived from Ch1 (red circle) was then used to segment the images from Ch2 and Ch3 into nuclear (Circ) and cytoplasmic (Ring) regions. The nuclear mask was eroded to reduce cytoplasm contamination within the nuclear area, and the reduced mask (yellow circle) was used to quantify the amount of target channel, p53-green fluorescent protein (GFP) in Ch2 and hDM2-red fluorescent protein (RFP) in Ch3, fluorescence within the nuclear region. The nuclear mask was then dilated to cover as much of the cytoplasmic region as possible without going outside the cell boundary. Removal of the original nuclear region from this dilated mask creates a ring mask that covers the cytoplasmic region outside the nuclear envelope. The number of pixels away from the nuclear mask and the number of pixels (width) between the inner and outer ring masks were selectable within the MT bioapplication software. The ring masks were then used to quantify the amount of target channel, p53-GFP (Ch2, mauve rings) or hDM2-RFP (Ch3, light blue rings), fluorescence within the cytoplasmic region. (B–D) Selected quantitative data outputs from the MT image analysis algorithm: (B) The selected object or cell counts (selected object counts per valid field of view [SCCPVF]) derived from Hoechst-stained nuclei in Ch1; (C) To quantify the relative distribution of the p53-GFP within the nucleus and the cytoplasmic regions, the MT image analysis algorithm calculates a mean average intensity difference by subtracting the average p53-GFP intensity in the Ring (cytoplasm) region from the average p53-GFP intensity in the Circ (nuclear) region of Ch2; Mean Circ–Ring Average Intensity Difference Channel 2 (MCRAID-Ch2); (D) To quantify the relative distribution of the hDM2-RFP within the nucleus and the cytoplasmic regions, the MT image analysis algorithm performs a similar calculation in Ch3 to generate a mean circle ring average intensity difference in channel 3 (MCRAID-Ch3) value. The data are presented as the mean SCCPVF (B), MCRAID-Ch2 (C), and MCRAID-Ch3 (D) values ± SD from 12 wells (n = 12). For the SCCPVF (B) and MCRAID-Ch2 (C) data, lines connecting the data were plotted using GraphPad Prism software 4.03. For the MCRAID-Ch3 (D) data, the resulting nonlinear regression curve was plotted using the following sigmoidal dose–response variable slope equation: Y = Bottom +[Top − Bottom]/[1 + 10^((LogEC50 − X) × Hill slope)], using Graphpad Prism software 4.03. Data from a single representative experiment of numerous experiments are presented.
Fig. 2.
Fig. 2.
Molecular translocation image analysis algorithm. p53-hDM2 protein–protein interaction biosensor (PPIB) adenovirus-infected cells were seeded at 2,500 cells per well in 384-well Greiner collagen-coated assay plates, cultured overnight at 37°C, 5% CO2, and 95% humidity, and were then treated for 90 min with the indicated concentrations of Nutlin-3, mixed enantiomers, in 0.5% dimethyl sulfoxide prior to fixation with 3.7% formaldehyde containing 2 μg/mL Hoechst 33342. Images from 3 fluorescent channels were sequentially acquired on the ArrayScan VTI platform using a 20× 0.4 NA objective with the XF93 excitation and emission filter set and were analyzed with the molecular translocation (MT) image analysis algorithm. (A) Image segmentation. Hoechst-stained objects in Ch1 that exhibited the appropriate fluorescent intensities above background and size characteristics (width, length, and area) were identified and classified by the image segmentation as nuclei. The nuclear mask derived from Ch1 (red circle) was then used to segment the images from Ch2 and Ch3 into nuclear (Circ) and cytoplasmic (Ring) regions. The nuclear mask was eroded to reduce cytoplasm contamination within the nuclear area, and the reduced mask (yellow circle) was used to quantify the amount of target channel, p53-green fluorescent protein (GFP) in Ch2 and hDM2-red fluorescent protein (RFP) in Ch3, fluorescence within the nuclear region. The nuclear mask was then dilated to cover as much of the cytoplasmic region as possible without going outside the cell boundary. Removal of the original nuclear region from this dilated mask creates a ring mask that covers the cytoplasmic region outside the nuclear envelope. The number of pixels away from the nuclear mask and the number of pixels (width) between the inner and outer ring masks were selectable within the MT bioapplication software. The ring masks were then used to quantify the amount of target channel, p53-GFP (Ch2, mauve rings) or hDM2-RFP (Ch3, light blue rings), fluorescence within the cytoplasmic region. (B–D) Selected quantitative data outputs from the MT image analysis algorithm: (B) The selected object or cell counts (selected object counts per valid field of view [SCCPVF]) derived from Hoechst-stained nuclei in Ch1; (C) To quantify the relative distribution of the p53-GFP within the nucleus and the cytoplasmic regions, the MT image analysis algorithm calculates a mean average intensity difference by subtracting the average p53-GFP intensity in the Ring (cytoplasm) region from the average p53-GFP intensity in the Circ (nuclear) region of Ch2; Mean Circ–Ring Average Intensity Difference Channel 2 (MCRAID-Ch2); (D) To quantify the relative distribution of the hDM2-RFP within the nucleus and the cytoplasmic regions, the MT image analysis algorithm performs a similar calculation in Ch3 to generate a mean circle ring average intensity difference in channel 3 (MCRAID-Ch3) value. The data are presented as the mean SCCPVF (B), MCRAID-Ch2 (C), and MCRAID-Ch3 (D) values ± SD from 12 wells (n = 12). For the SCCPVF (B) and MCRAID-Ch2 (C) data, lines connecting the data were plotted using GraphPad Prism software 4.03. For the MCRAID-Ch3 (D) data, the resulting nonlinear regression curve was plotted using the following sigmoidal dose–response variable slope equation: Y = Bottom +[Top − Bottom]/[1 + 10^((LogEC50 − X) × Hill slope)], using Graphpad Prism software 4.03. Data from a single representative experiment of numerous experiments are presented.
Fig. 3.
Fig. 3.
Optimization of the p53-hDM2 protein–protein interaction biosensor (PPIB) high-content screening assay. (A) Cell seeding density. p53-hDM2 PPIB adenovirus-infected cells were seeded at the indicated cell densities in the wells of 384-well Greiner collagen-coated assay plates, cultured overnight at 37°C, 5% CO2, and 95% humidity, and were then treated for 90 min with either 0.5% dimethyl sulfoxide (DMSO) (□) or 10 μM Nutlin-3 in 0.5% DMSO (▪) prior to fixation with 3.7% formaldehyde containing 2 μg/mL Hoechst 33342. (B) Scalability of the p53-hDM2 PPIB adenovirus coinfection process. U-2 OS cells ranging between 3 × 106 and 1.5 × 107 cells in 1.5 mL of media were coincubated with the manufacturer's recommended volumes of the p53-hDM2 PPIB adenoviruses for 30 min. Coinfected cells were then seeded at 2,500 cells per well in 384-well Greiner collagen-coated assay plates, cultured overnight at 37°C, 5% CO2, and 95% humidity, and were then treated for 90 min with either 0.5% DMSO (□) or 10 μM Nutlin-3 in 0.5% DMSO (▪) prior to fixation with 3.7% formaldehyde containing 2 μg/mL Hoechst 33342. (C) Time course of Nutlin-3 disruption. U-2 OS cells were coinfected with the p53-hDM2 PPIB adenoviruses, seeded at 2,500 cells per well in 384-well Greiner collagen-coated assay plates, and cultured overnight at 37°C, 5% CO2, and 95% humidity as described earlier. Cells were then treated with the indicated concentrations of Nutlin-3 and then fixed and stained with Hoechst at 5 min intervals up to 30 min total exposure time; (▪) 5 min, (▴) 10 min, (▾) 15 min, (♦) 20 min, (●) 25 min, and (□) 30 min. (D) Reversibility and stability of the p53-hDM2 PPIB assay signal window. U-2 OS cells were coinfected with the p53-hDM2 PPIB adenoviruses, seeded at 2,500 cells per well in 384-well Greiner collagen-coated assay plates, and cultured overnight at 37°C, 5% CO2, and 95% humidity as described earlier. Cells were then treated with 10 μM Nutlin-3 for 90 min. Half the wells were then washed 3 times with fresh McCoy's 5A medium (□) and the remainder were left untouched (▪). Cells were incubated further at 37°C, 5% CO2, and 95% humidity for the indicated times prior to fixation with 3.7% formaldehyde containing 2 μg/mL Hoechst 33342. Images from 3 fluorescent channels were sequentially acquired on the ArrayScan VTI platform using a 10× 0.3 NA objective with the XF93 excitation and emission filter set and were analyzed with molecular translocation (MT) image analysis algorithm. The mean circle ring average intensity difference in channel 3 (MCRAID-Ch3) data derived from the MT image analysis algorithm is a measure of the relative distribution of the hDM2-red fluorescent protein within the nucleus and the cytoplasmic regions and was used as the primary indicator of the interactions between p53 with hDM2. The data are presented as the mean MCRAID-Ch3 values ± SD from (A) n = 32 wells, (B) n = 96 wells, (C) n = 4 wells, and (D) n = 6 wells. The lines connecting the data were plotted using Graphpad Prism software 4.03. Data from a single representative experiment of 3 or more experiments are presented in AC, and from a single experiment in D.
Fig. 4.
Fig. 4.
Dimethyl sulfoxide (DMSO) tolerance and Nutlin-3 IC50 determinations. (A) DMSO tolerance. U-2 OS cells were coinfected with the p53-hDM2 protein–protein interaction biosensor (PPIB) adenoviruses, seeded at 2,500 cells per well in 384-well Greiner collagen-coated assay plates, and cultured overnight at 37°C, 5% CO2, and 95% humidity as described earlier. Cells were then treated with 0.5% DMSO (□) or 10 μM Nutlin-3 (▪) at the indicated concentrations of DMSO for 90 min prior to fixation with 3.7% formaldehyde containing 2 μg/mL Hoechst 33342. (B) Nutlin-3 IC50 determinations from 3 independent experiments. U-2 OS cells were coinfected with the p53-hDM2 PPIB adenoviruses, seeded at 2,500 cells per well in 384-well Greiner collagen-coated assay plates, and cultured overnight at 37°C, 5% CO2, and 95% humidity as described earlier. Cells were then treated with the indicated concentrations of Nutlin-3 for 90 min prior to fixation with 3.7% formaldehyde containing 2 μg/mL Hoechst 33342. Images were acquired on the ArrayScan VTI platform and analyzed with molecular translocation image analysis algorithm as described for Figure 2. The mean circle ring average intensity difference in channel 3 (MCRAID-Ch3) data was used as the primary indicator of the interactions between p53 and hDM2. The data are presented as the mean MCRAID-Ch3 values ± SD from (A) n = 16 wells, (B) n = 16 wells at day 1, and n = 24 wells at days 2 and 3. For the IC50 determinations, the resulting nonlinear regression curves were plotted using the following sigmoidal dose–response variable slope equation: Y = Bottom + [Top − Bottom]/[1 + 10^((LogEC50 − X) × Hill slope)], using Graphpad Prism software 4.03. Data from a single representative experiment of 2 independent DMSO-tolerance experiments are presented in A, and the data from 3 independent IC50 experiments are presented in B. The IC50s for the disruption of the p53-hDM3 PPIB were 1.196, 0.394, and 0.680 μM on days 1, 2, and 3, respectively.
Fig. 5.
Fig. 5.
Three-day assay signal window and Z-factor determination. U-2 OS cells were coinfected with the p53-hDM2 protein–protein interaction biosensor adenoviruses, seeded at 2,500 cells per well in 384-well Greiner collagen-coated assay plates, and cultured overnight at 37°C, 5% CO2, and 95% humidity as described earlier. Two maximum control plates (max plate 1 ⋄, max plate 2 ○) were then treated with 0.5% dimethyl sulfoxide and 2 minimum control plates (min plate 1 □, min plate 2 ▵) were treated with 10 μM Nutlin-3 for 90 min prior to fixation with 3.7% formaldehyde containing 2 μg/mL Hoechst 33342. Images were acquired on the ArrayScan VTI platform and analyzed with the molecular translocation image analysis algorithm as described for Figure 2. The mean circle ring average intensity difference in channel 3 (MCRAID-Ch3) data was used as the primary indicator of the interactions between p53 and hDM2. Three independent experiments of 2 full 384-well plates each of maximum and minimum plate controls were conducted on 3 separate days (Table 1). A scatter plot of the hDM2-red fluorescent protein MCRAID-Ch3 signals from the 2 full 384-well plates each of maximum (n = 768) and minimum (n = 768) controls performed on day 3 is presented.
Fig. 6.
Fig. 6.
p53-hDM2 protein–protein interaction biosensor (PPIB) Library of Pharmacologically Active Compounds (LOPAC) high-content screen. U-2 OS cells were coinfected with the p53-hDM2 PPIB adenoviruses, seeded at 2,500 cells per well in 384-well Greiner collagen-coated assay plates, and cultured overnight at 37°C, 5% CO2, and 95% humidity as described earlier. Diluted compounds and plate controls were transferred from the 4 × 384-well LOPAC daughter plates or control blocks to the p53-hDM2 PPIB assay plates to provide a final screening concentration of 50 μM and then incubated for 90 min prior to fixation with 3.7% formaldehyde containing 2 μg/mL Hoechst 33342. Images were acquired on the ArrayScan VTI platform and analyzed with the molecular translocation image analysis algorithm as described for Figure 2. The mean circle ring average intensity difference in channel 3 (MCRAID-Ch3) data was used as the primary indicator of the interactions between p53 and hDM2. (A) Four-plate overlay of percent inhibition for the LOPAC Screen. An ActivityBase primary HTS template was created that automatically calculated the percent inhibition. The mean MCRAID-Ch3 value of the dimethyl sulfoxide (DMSO) minimum plate control wells (●, n = 32 per plate) and the mean MCRAID-Ch3 value of the 10 μM Nutlin-3 maximum plate control wells (▪, n = 24) were used to normalize the MCRAID-Ch3 compound data (○) and to represent 0% and 100% disruption/inhibition of the p53-hDM2 interactions, respectively. Potential active compounds (gray circle, ●) with greater than 40% inhibition are indicated. (B) High-content screening (HCS) performance. An ActivityBase primary HTS template was created, which automatically calculated the plate control signal-to-background (S:B) ratios and Z′-factors using the MCRAID-Ch3 values of the DMSO minimum plate control wells (n = 32 per plate) and the 10 μM Nutlin-3 maximum plate control wells (n = 24). Z′-factors (∘) and S:B ratios (●) for the four 384-well plates of the LOPAC screen. (C) Chemical structures, names, and percent inhibition of the LOPAC HCS actives. The chemical structures, names, and percent inhibition for 9 compounds that exhibited ≥35% inhibition and for Nutlin-3 are presented.
Fig. 7.
Fig. 7.
Selected images of the p53-hDM2 protein–protein interaction biosensor (PPIB) Library of Pharmacologically Active Compounds actives. U-2 OS cells were coinfected with the p53-hDM2 PPIB adenoviruses, seeded at 2,500 cells per well in 384-well Greiner collagen-coated assay plates, and cultured overnight at 37°C, 5% CO2, and 95% humidity as described earlier. Cells were then treated with the indicated concentrations of the putative active compounds for 90 min prior to fixation with 3.7% formaldehyde containing 2 μg/mL Hoechst 33342. Individual gray-scale and 3-color composite images of U-2 OS cells from 3 fluorescent channels (Hoechst Ch1, green fluorescent protein [GFP] Ch2, and red fluorescent protein (RFP) Ch3) were sequentially acquired on the ArrayScan VTI platform using a 10× 0.3 NA objective with the XF93 excitation and emission filter set (Hoechst, blue; FITC, green; TRITC, red). (A) Hoechst channel, (B) p53-GFP channel, (C) hDM2-RFP channel, and (D) composite 3-color images.
Fig. 7.
Fig. 7.
Selected images of the p53-hDM2 protein–protein interaction biosensor (PPIB) Library of Pharmacologically Active Compounds actives. U-2 OS cells were coinfected with the p53-hDM2 PPIB adenoviruses, seeded at 2,500 cells per well in 384-well Greiner collagen-coated assay plates, and cultured overnight at 37°C, 5% CO2, and 95% humidity as described earlier. Cells were then treated with the indicated concentrations of the putative active compounds for 90 min prior to fixation with 3.7% formaldehyde containing 2 μg/mL Hoechst 33342. Individual gray-scale and 3-color composite images of U-2 OS cells from 3 fluorescent channels (Hoechst Ch1, green fluorescent protein [GFP] Ch2, and red fluorescent protein (RFP) Ch3) were sequentially acquired on the ArrayScan VTI platform using a 10× 0.3 NA objective with the XF93 excitation and emission filter set (Hoechst, blue; FITC, green; TRITC, red). (A) Hoechst channel, (B) p53-GFP channel, (C) hDM2-RFP channel, and (D) composite 3-color images.
Fig. 8.
Fig. 8.
Quantitative image analysis data for the p53-hDM2 protein–protein interaction biosensor (PPIB) Library of Pharmacologically Active Compounds actives. U-2 OS cells were coinfected with the p53-hDM2 PPIB adenoviruses, seeded at 2,500 cells per well in 384-well Greiner collagen-coated assay plates, and cultured overnight at 37°C, 5% CO2, and 95% humidity as described earlier. Cells were then treated with the indicated concentrations of the putative active compounds for 90 min prior to fixation with 3.7% formaldehyde containing 2 μg/mL Hoechst 33342. Images were acquired on the ArrayScan VTI platform and analyzed with the molecular translocation (MT) image analysis algorithm as described for Figure 2. Selected quantitative data outputs from the MT image analysis algorithm: (A) The selected object or cell counts (selected object counts per valid field of view [SCCPVF]) derived from Hoechst-stained nuclei in Ch1; (B) the mean average fluorescent intensity in the Ch2 (p53-green fluorescent protein) cytoplasm ring region (mean ring average intensity in channel 2 [MRAI-Ch2]); (C) the mean average fluorescent intensity in the Ch3 (hDM2-red fluorescent protein [RFP]) cytoplasmic ring region (mean ring average intensity in channel 3 [MRAI-Ch3]); and (D) the mean circle ring average intensity difference in channel 3 (MCRAID-Ch3) values used to quantify the relative distribution of the hDM2-RFP between the nucleus and the cytoplasmic regions in Ch3. The data are presented as the mean SCCPVF (A), MRAI-Ch2 (B), and MRAI-Ch3 (C) values ± SD from triplicate wells (n = 3) at the top compound concentration tested 50 μM (25 μM for topotecan). Medium control (open bars), Nutlin-3 control (hashed bars), and compounds (black bars). For the MCRAID-Ch3 concentration–response data (D), the mean MCRAID-Ch3 values ± SD from triplicate wells (n = 3) at each compound concentration together with their resulting nonlinear regression curves were plotted using the following sigmoidal dose–response variable slope equation: Y = Bottom + [Top − Bottom]/[1 + 10^((LogEC50 − X) × Hill slope)], using Graphpad Prism software 4.03. Data from a single representative experiment of 3 experiments are presented.

References

    1. Colas P. High-throughput screening assays to discover small-molecule inhibitors of protein interactions. Curr Drug Discov Technol. 2008;5:190–199. - PubMed
    1. Lalonde S. Ehrhardt DW. Loqué D. Chen J. Rhee SY. Frommer WB. Molecular and cellular approaches for the detection of protein-protein interactions: latest techniques and current limitations. Plant J. 2008;53:610–635. - PubMed
    1. Pagliaro L. Felding J. Audouze K. Nielsen SJ. Terry RB. Krog-Jensen C. Butcher S. Emerging classes of protein-protein interaction inhibitors and new tools for their development. Curr Opin Chem Biol. 2004;8:442–449. - PubMed
    1. Cummings M. Farnum MA. Nelen MI. Universal screening methods and applications of ThermoFluor. J Biomol Screen. 2006;11:854–863. - PubMed
    1. Lievens S. Lemmens I. Tavernier J. Mammalian two-hybrids come of age. Trends Biochem Sci. 2009;34:579–588. - PMC - PubMed

Publication types

MeSH terms