The relation between neuromechanical parameters and Ashworth score in stroke patients
- PMID: 20663189
- PMCID: PMC2927906
- DOI: 10.1186/1743-0003-7-35
The relation between neuromechanical parameters and Ashworth score in stroke patients
Abstract
Background: Quantifying increased joint resistance into its contributing factors i.e. stiffness and viscosity ("hypertonia") and stretch reflexes ("hyperreflexia") is important in stroke rehabilitation. Existing clinical tests, such as the Ashworth Score, do not permit discrimination between underlying tissue and reflexive (neural) properties. We propose an instrumented identification paradigm for early and tailor made interventions.
Methods: Ramp-and-Hold ankle dorsiflexion rotations of various durations were imposed using a manipulator. A one second rotation over the Range of Motion similar to the Ashworth condition was included. Tissue stiffness and viscosity and reflexive torque were estimated using a nonlinear model and compared to the Ashworth Score of nineteen stroke patients and seven controls.
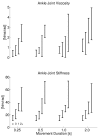
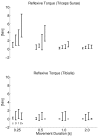
Results: Ankle viscosity moderately increased, stiffness was indifferent and reflexive torque decreased with movement duration. Compared to controls, patients with an Ashworth Score of 1 and 2+ were significantly stiffer and had higher viscosity and patients with an Ashworth Score of 2+ showed higher reflexive torque. For the one second movement, stiffness correlated to Ashworth Score (r2 = 0.51, F = 32.7, p < 0.001) with minor uncorrelated reflexive torque. Reflexive torque correlated to Ashworth Score at shorter movement durations (r2 = 0.25, F = 11, p = 0.002).
Conclusion: Stroke patients were distinguished from controls by tissue stiffness and viscosity and to a lesser extent by reflexive torque from the soleus muscle. These parameters were also sensitive to discriminate patients, clinically graded by the Ashworth Score. Movement duration affected viscosity and reflexive torque which are clinically relevant parameters. Full evaluation of pathological joint resistance therefore requires instrumented tests at various movement conditions.
Figures



Similar articles
-
Early Shortening of Wrist Flexor Muscles Coincides With Poor Recovery After Stroke.Neurorehabil Neural Repair. 2018 Jun;32(6-7):645-654. doi: 10.1177/1545968318779731. Epub 2018 Jun 25. Neurorehabil Neural Repair. 2018. PMID: 29938584 Free PMC article. Clinical Trial.
-
Estimation of tissue stiffness, reflex activity, optimal muscle length and slack length in stroke patients using an electromyography driven antagonistic wrist model.Clin Biomech (Bristol). 2016 Jun;35:93-101. doi: 10.1016/j.clinbiomech.2016.03.012. Epub 2016 Apr 8. Clin Biomech (Bristol). 2016. PMID: 27149565
-
Muscle and reflex changes with varying joint angle in hemiparetic stroke.J Neuroeng Rehabil. 2008 Feb 27;5:6. doi: 10.1186/1743-0003-5-6. J Neuroeng Rehabil. 2008. PMID: 18304313 Free PMC article.
-
The gap between clinical gaze and systematic assessment of movement disorders after stroke.J Neuroeng Rehabil. 2012 Aug 27;9:61. doi: 10.1186/1743-0003-9-61. J Neuroeng Rehabil. 2012. PMID: 22925463 Free PMC article. Review.
-
Applicability of the Instrumented Pendulum Test for Assessing Limb Viscoelastic Properties in Neurological and Internal Diseases: A Narrative Review.Life (Basel). 2025 Mar 24;15(4):535. doi: 10.3390/life15040535. Life (Basel). 2025. PMID: 40283090 Free PMC article. Review.
Cited by
-
Early Shortening of Wrist Flexor Muscles Coincides With Poor Recovery After Stroke.Neurorehabil Neural Repair. 2018 Jun;32(6-7):645-654. doi: 10.1177/1545968318779731. Epub 2018 Jun 25. Neurorehabil Neural Repair. 2018. PMID: 29938584 Free PMC article. Clinical Trial.
-
Passive material properties of stroke-impaired plantarflexor and dorsiflexor muscles.Clin Biomech (Bristol). 2017 Nov;49:48-55. doi: 10.1016/j.clinbiomech.2017.08.009. Epub 2017 Aug 24. Clin Biomech (Bristol). 2017. PMID: 28866442 Free PMC article.
-
Quantitative measurement of resistance force and subsequent attenuation during passive isokinetic extension of the wrist in patients with mild to moderate spasticity after stroke.J Neuroeng Rehabil. 2022 Oct 13;19(1):110. doi: 10.1186/s12984-022-01087-3. J Neuroeng Rehabil. 2022. PMID: 36224659 Free PMC article.
-
Neuro-musculoskeletal simulation of instrumented contracture and spasticity assessment in children with cerebral palsy.J Neuroeng Rehabil. 2016 Jul 16;13(1):64. doi: 10.1186/s12984-016-0170-5. J Neuroeng Rehabil. 2016. PMID: 27423898 Free PMC article.
-
Correlation of Resting Elbow Angle with Spasticity in Chronic Stroke Survivors.Front Neurol. 2015 Aug 26;6:183. doi: 10.3389/fneur.2015.00183. eCollection 2015. Front Neurol. 2015. PMID: 26379617 Free PMC article.
References
Publication types
MeSH terms
LinkOut - more resources
Full Text Sources
Medical

