

Angiotensin II mediates the high-glucose-induced endothelial-to-mesenchymal transition in human aortic endothelial cells
- PMID: 20663195
- PMCID: PMC2920267
- DOI: 10.1186/1475-2840-9-31
Angiotensin II mediates the high-glucose-induced endothelial-to-mesenchymal transition in human aortic endothelial cells
Abstract
Background: Substantial evidence suggests that high glucose (HG) causes endothelial cell damage; however, the potential mechanism therein has yet to be clarified. The aim of this study was to investigate the influence of HG on the endothelial-to-mesenchymal transition (EndMT) and its relevance to the activation of the renin-angiotensin system.
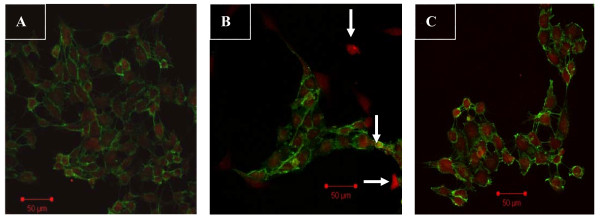
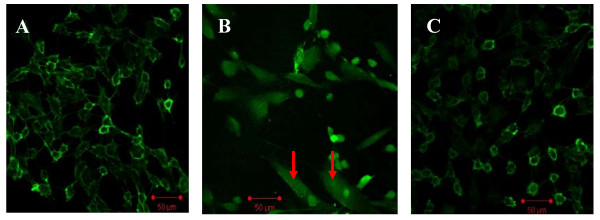
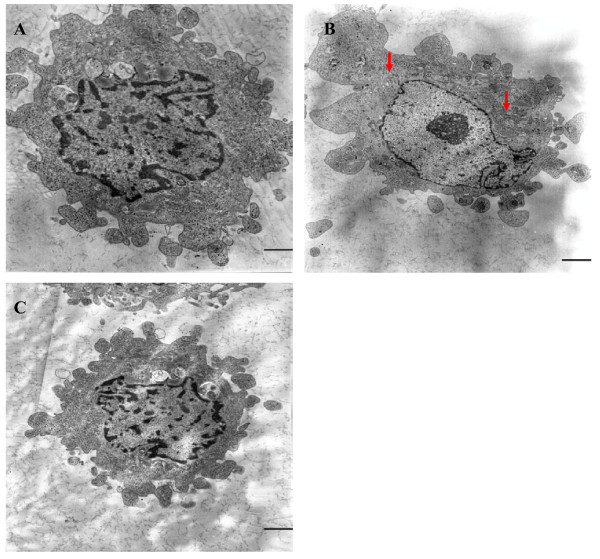
Methods: Primary human aortic endothelial cells (HAECs) were divided into three groups: a normal glucose (NG) group, HG group, and irbesartan (1 microM)-treated (HG+irbesartan) group. The concentration of angiotensin II in the supernatant was detected by radioimmunoassay. Pathological changes were investigated using fluorescence microscopy and electron microscopy. Immunofluorescence staining was performed to detect the co-expression of CD31 and fibroblast markers, such as fibroblast-specific protein 1 (FSP1). The expressions of FSP1 and alpha-SMA were detected by RT-PCR and Western blot.
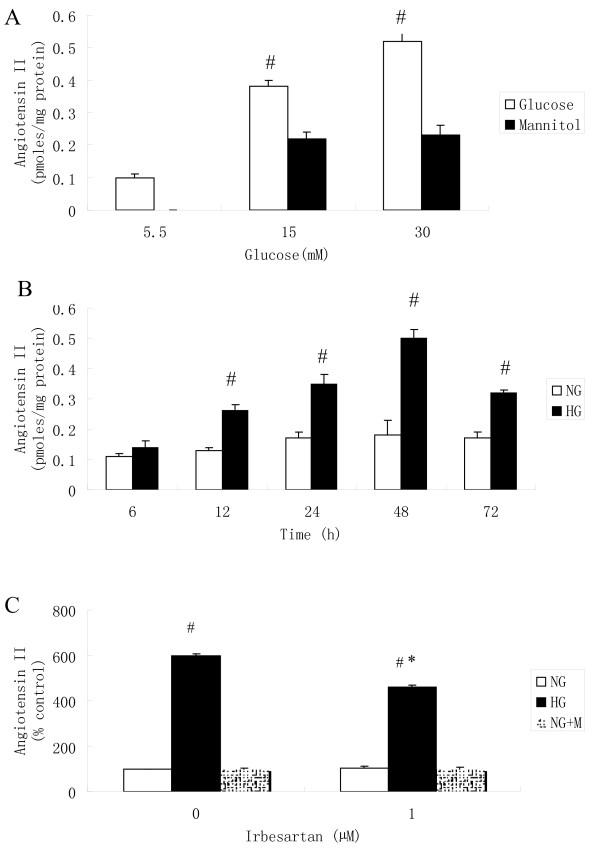
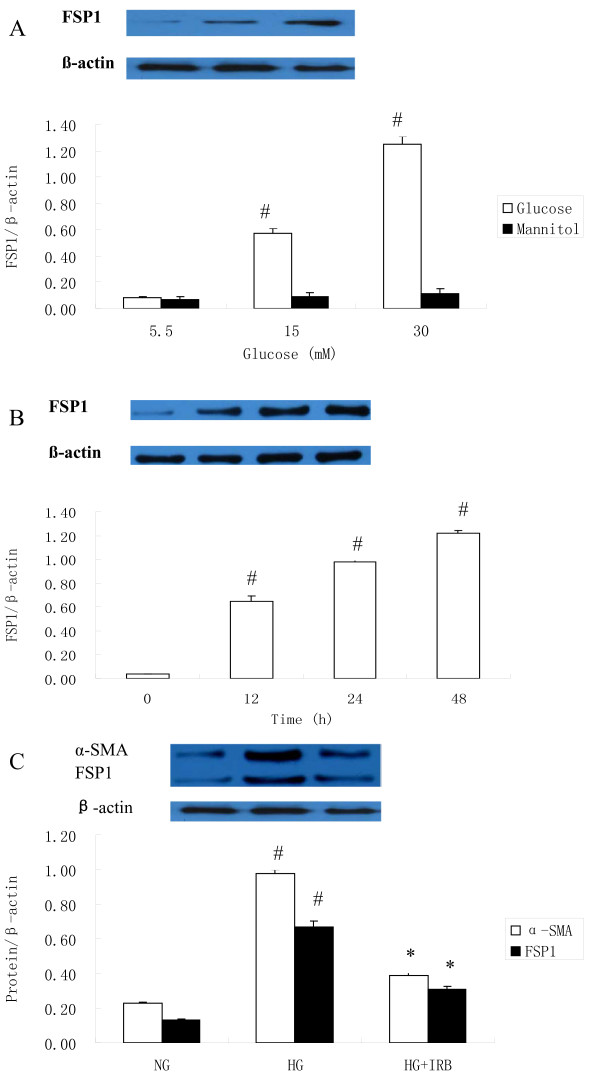
Results: The treatment of HAECs in the HG group resulted in significant increases in the expressions of FSP1 and angiotensin II in dose-and time-dependent manners. The incubation of HAECs exposure to HG resulted in a fibroblast-like phenotype, wherein increased microfilamentation and a roughened endoplasmic reticulum structure were observed in the cytoplasm. The expressions of FSP1 and alpha-SMA were significantly increased in the HG group, and these changes were inhibited by irbesartan treatment (P < 0.05). Double staining of the HAECs indicated a co-localization of CD31 and FSP1 and that some cells acquired spindle-shaped morphologies and a loss of CD31 staining; however, treatment with irbesartan attenuated the expression of EndMT (P < 0.05).
Conclusions: These findings suggest a novel mechanism in HG-induced endothelial damage via the mediation of the EndMT by angiotensin II, which was inhibited by Irbesartan.
Figures

Similar articles
-
Interleukin-1β mediates high glucose induced phenotypic transition in human aortic endothelial cells.Cardiovasc Diabetol. 2016 Mar 5;15:42. doi: 10.1186/s12933-016-0358-9. Cardiovasc Diabetol. 2016. PMID: 26944557 Free PMC article.
-
Effects of angiotensin II receptor blocker on myocardial endothelial-to-mesenchymal transition in diabetic rats.Int J Cardiol. 2013 Jan 10;162(2):92-9. doi: 10.1016/j.ijcard.2011.06.052. Epub 2011 Jun 24. Int J Cardiol. 2013. PMID: 21704391
-
High glucose mediates endothelial-to-chondrocyte transition in human aortic endothelial cells.Cardiovasc Diabetol. 2012 Sep 22;11:113. doi: 10.1186/1475-2840-11-113. Cardiovasc Diabetol. 2012. PMID: 22998723 Free PMC article.
-
Angiotensin II type 1 receptor blockers.Circulation. 2001 Feb 13;103(6):904-12. doi: 10.1161/01.cir.103.6.904. Circulation. 2001. PMID: 11171802 Review. No abstract available.
-
An update of irbesartan and renin-angiotensin system blockade in diabetic nephropathy.Expert Opin Pharmacother. 2005 Aug;6(9):1587-96. doi: 10.1517/14656566.6.9.1587. Expert Opin Pharmacother. 2005. PMID: 16086646 Review.
Cited by
-
Increased miR-7641 Levels in Peritoneal Hyalinizing Vasculopathy in Long-Term Peritoneal Dialysis Patients.Int J Mol Sci. 2020 Aug 13;21(16):5824. doi: 10.3390/ijms21165824. Int J Mol Sci. 2020. PMID: 32823722 Free PMC article.
-
miR-132-3p and KLF7 as novel regulators of aortic stiffening-associated EndMT in type 2 diabetes mellitus.Diabetol Metab Syndr. 2023 Jan 25;15(1):11. doi: 10.1186/s13098-022-00966-y. Diabetol Metab Syndr. 2023. PMID: 36698180 Free PMC article.
-
MicroRNA-142-3p inhibits high-glucose-induced endothelial-to-mesenchymal transition through targeting TGF-β1/Smad pathway in primary human aortic endothelial cells.Int J Clin Exp Pathol. 2018 Mar 1;11(3):1208-1217. eCollection 2018. Int J Clin Exp Pathol. 2018. PMID: 31938215 Free PMC article.
-
Research Progress and Molecular Mechanisms of Endothelial Cells Inflammation in Vascular-Related Diseases.J Inflamm Res. 2023 Aug 23;16:3593-3617. doi: 10.2147/JIR.S418166. eCollection 2023. J Inflamm Res. 2023. PMID: 37641702 Free PMC article. Review.
-
Inflammatory stress exacerbates the progression of cardiac fibrosis in high-fat-fed apolipoprotein E knockout mice via endothelial-mesenchymal transition.Int J Med Sci. 2013;10(4):420-6. doi: 10.7150/ijms.5723. Epub 2013 Feb 28. Int J Med Sci. 2013. PMID: 23471419 Free PMC article.
References
Publication types
MeSH terms
Substances
LinkOut - more resources
Full Text Sources
Research Materials
