. 2010 Jul 1;4(4):882-92.
doi: 10.1177/193229681000400417.

Toward an injectable continuous osmotic glucose sensor

Affiliations

Toward an injectable continuous osmotic glucose sensor

Erik Johannessen et al. J Diabetes Sci Technol. .

Abstract

Background: The growing pandemic of diabetes mellitus places a stringent social and economic burden on the society. A tight glycemic control circumvents the detrimental effects, but the prerogative is the development of new more effective tools capable of longterm tracking of blood glucose (BG) in vivo. Such discontinuous sensor technologies will benefit from an unprecedented marked potential as well as reducing the current life expectancy gap of eight years as part of a therapeutic regime.

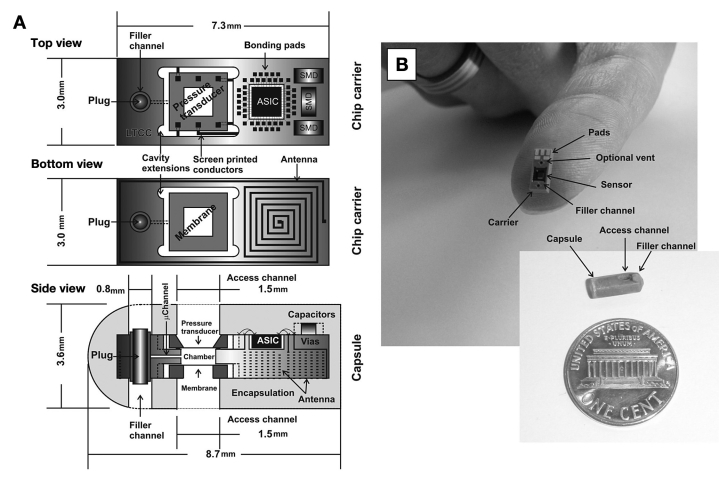
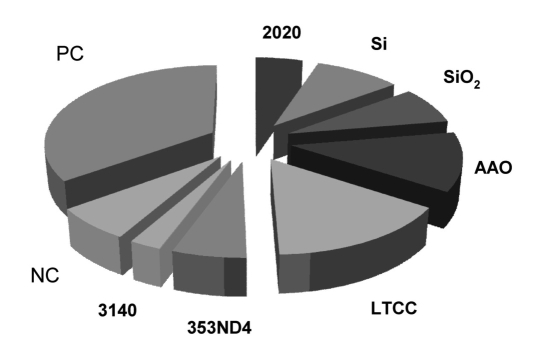
Method: A sensor technology based on osmotic pressure incorporates a reversible competitive affinity assay performing glucose-specific recognition. An absolute change in particles generates a pressure that is proportional to the glucose concentration. An integrated pressure transducer and components developed from the silicon micro- and nanofabrication industry translate this pressure into BG data.

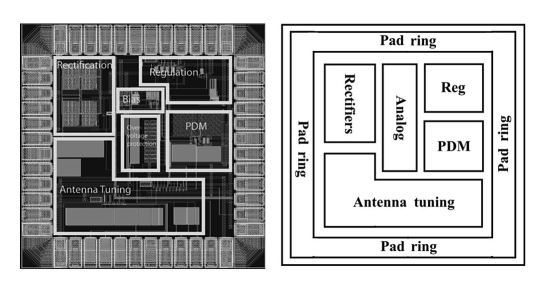
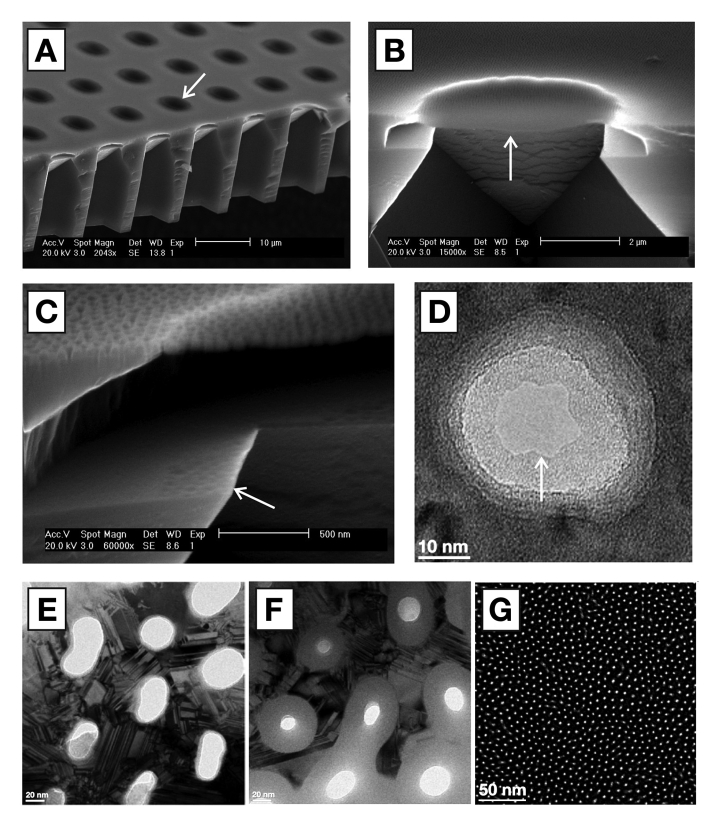
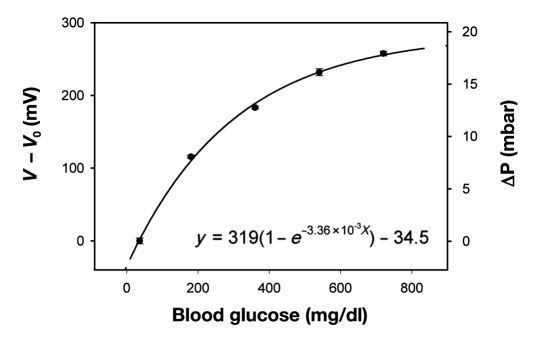
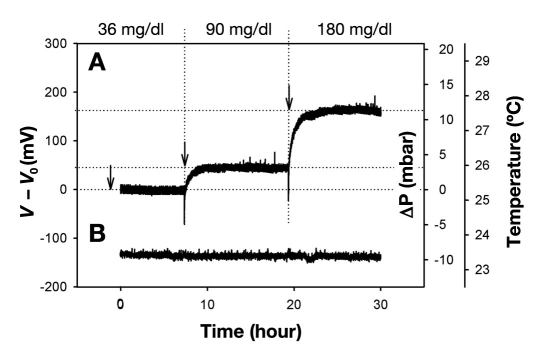
Results: An in vitro model based on a 3.6 x 8.7 mm large pill-shaped implant is equipped with a nanoporous membrane holding 4-6 nm large pores. The affinity assay offers a dynamic range of 36-720 mg/dl with a resolution of +/-16 mg/dl. An integrated 1 x 1 mm(2) large control chip samples the sensor signals for data processing and transmission back to the reader at a total power consumption of 76 microW.

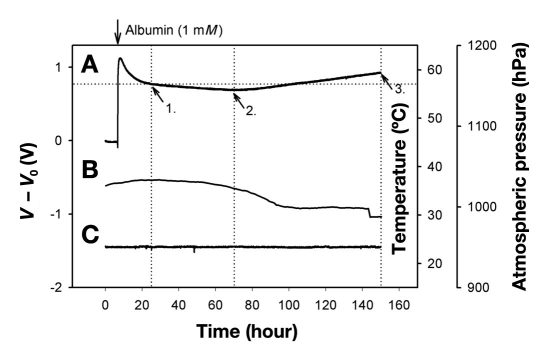
Conclusions: Current studies have demonstrated the design, layout, and performance of a prototype osmotic sensor in vitro using an affinity assay solution for up to four weeks. The small physical size conforms to an injectable device, forming the basis of a conceptual monitor that offers a tight glycemic control of BG.


Figures

Figure 1.
Figure 1.
Computer-aided design depicting the architecture of the sensor implant (A). The sensor chip, incorporating a differential pressure transducer located at the front, followed by the ASIC (including temperature compensation) and components of the inductive powering and telemetry interface. The membrane and the inductive coil antenna are assembled on the reverse side. The whole unit is encapsulated in epoxy resin (Araldite 2020), with a filler channel enabling injection of the aqueous osmotic active solution prior to operation. (B) Assembled prototype carrier and capsule. An optional venting channel assisted filling in early versions.
Figure 2.
Figure 2.
X-ray image of the pressure transducer attached face down on the LTCC by flip-chip thermocompression bonding, as seen from above (A) and at an angle (B). This inspection offers the only means to assess the quality of the bond by looking for open circuits and poor connections (visible as thin white lines).
Figure 3.
Figure 3.
Layout plot of the 1 × 1 mm2ASIC control chip (left), and the associated explanatory diagram (right). The sensor data was sampled and converted for transmission on a serial digital wireless link using a pulse density modulation. The low sampling rate (one per five minutes) combined with the low power allowance inspired the use of time domain encoding in which the intervals between digital signals were used to encode analog data without the need for a full analog to digital conversion.
Figure 4.
Figure 4.
Scanning electron microscope image showing the membrane support structure (A) with 5 µm suspended (free standing) membrane elements (arrow). (B) Cross section of individual element (arrow) showing the porous nature of the membrane (C) visible through the indentations left on the nearby silicon shelf (arrow) due to the etching gas penetrating the membrane. Nanopore (D) visible through a transmission electron microscope. Pore shrinking protocol illustrating the oxidation of larger pores (E) triggering a size reduction of more than 50% (F), down to the current limit of 5 nm (G).
Figure 5.
Figure 5.
Calibration curve showing the affinity assay response to changing glucose concentrations from 36 to 720 mg/dl (n = 3) at room temperature. The sensor was cycled between 40 mM – 2 mM – 40 mM – 2 mM – 40 mM – 2 mM, in order to obtain three consecutive measurements, and where the 2 mM was consequently replaced with 10, 20, 30, and 40 mM in one continuous trial. The small error bars shows that any hysteresis effects are negligible. The corresponding osmotic pressure was calculated from sensor calibration using an external pneumatic source.
Figure 6.
Figure 6.
Sensor response (A) to changing glucose values within the normal physiological range spanning subhypoglycemia at 36 mg/dl, normal blood glucose of 90 mg/dl, to hyperglycemia at 180 mg/dl. The negative spikes associated with the transition from lower to higher glucose levels can be ascribed to the inherent diffusion barrier poised by the membrane delaying the permeation of glucose into the sensor. Temperature (B) was maintained at a stable ambient of 23.4 °C.
Figure 7.
Figure 7.
Sensor response (A) using albumin (1 mM) as a model compound over a period of one week. Following an exponential decay believed to be the loss of albumin through the sensor sealant, the signal maintains a steady drift (arrow 1) until halfway through the measurement period (arrow 2), followed by a positive drift until the end of the experiment. The drift can be ascribed to the minute diffusion of water into the epoxy resin used as the sealant of the pressure transducer, hence causing it to swell and thereby exerting pressure/strain on the transducer chip. The signal was impervious to ambient atmospheric pressure (B) and temperature variations (C).
Figure 8.
Figure 8.
TCC deposition (% of total) on the surface of material candidates of the CGM implant (n = 20). Three of the seven materials exhibited a larger response than the negative control (NC) suggesting that the immunological response would require modulation prior to implantation of these target materials. None of the materials exhibited a larger response than the heat-aggregated immunoglobulin G used as a positive control (PC).

Similar articles

Cited by

References

    1. Dufaitre-Patouraux L, Vague P, Lassmann-Vague V. History, accuracy and precision of SMBG devices. Diabetes Metab. 2003;29(2):S7–S14. - PubMed
    1. Clemens AH. USA: Miles Laboratories, Inc.; 1971. Reflectance meter. In: patent US, vol. 3,604,815.
    1. Clark LC, Jr, Lyons C. Electrode systems for continous monitoring in cardiovascular surgery. Ann N Y Acad Sci. 1962;102:29–45. - PubMed
    1. Fjield T, Higgins MJ. USA: Edwards Lifesciences Corporation; 2009. Monitoring and compensating for temperature-related error in an electrochemical sensor. In: Edited by patent US.
    1. Kurahashi K, Maruta H, Usuda Y, Ohtsuka M. Influence of blood sample oxygen tension on blood glucose concentration measured using an enzyme-electrode method. Crit Care Med. 1997;25(2):231–235. - PubMed

Publication types