

Zone model predictive control: a strategy to minimize hyper- and hypoglycemic events
- PMID: 20663463
- PMCID: PMC2909531
- DOI: 10.1177/193229681000400428
Zone model predictive control: a strategy to minimize hyper- and hypoglycemic events
Abstract
Background: Development of an artificial pancreas based on an automatic closed-loop algorithm that uses a subcutaneous insulin pump and continuous glucose sensor is a goal for biomedical engineering research. However, closing the loop for the artificial pancreas still presents many challenges, including model identification and design of a control algorithm that will keep the type 1 diabetes mellitus subject in normoglycemia for the longest duration and under maximal safety considerations.
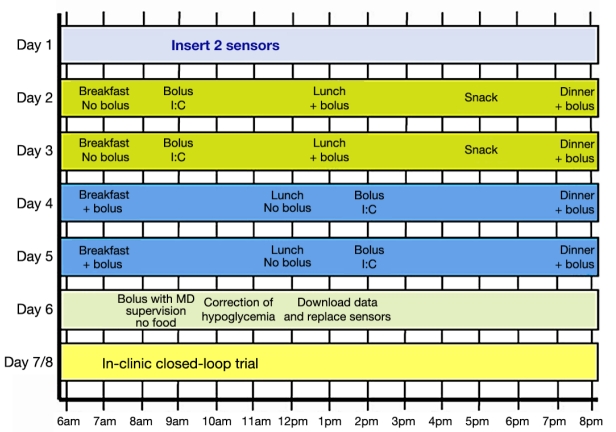
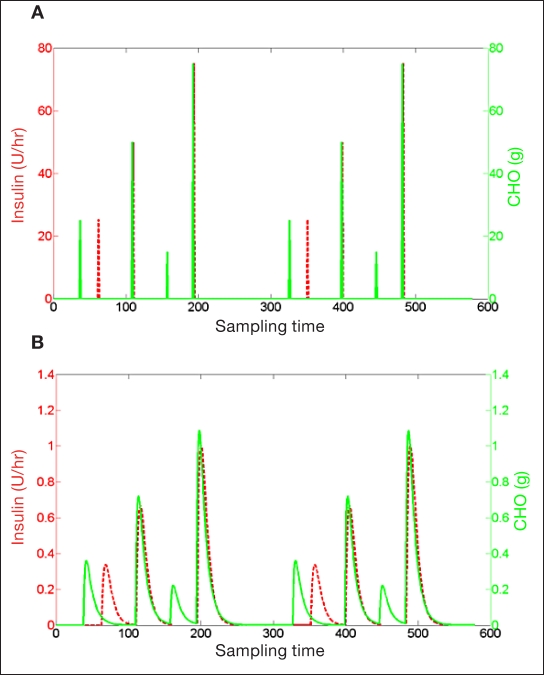
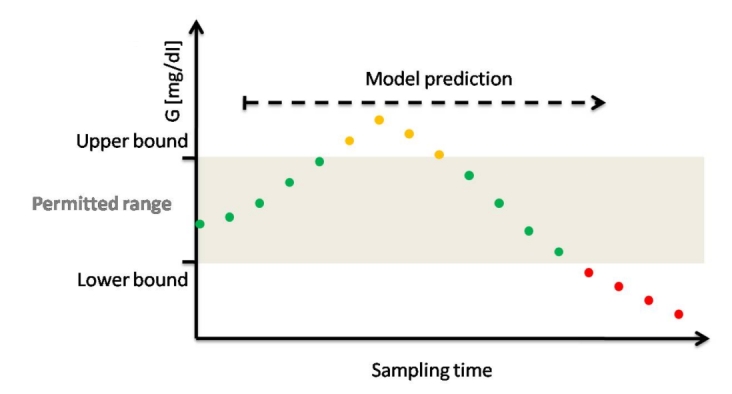
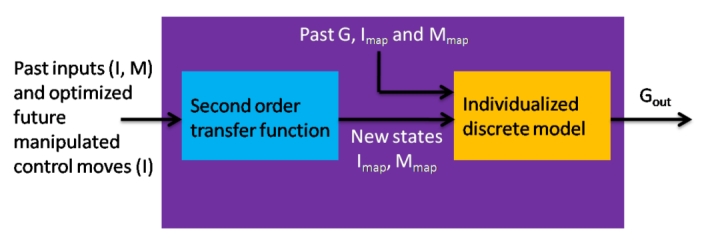
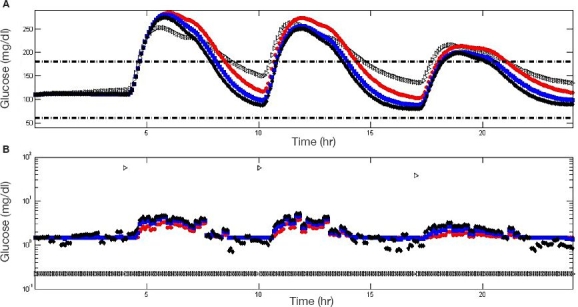
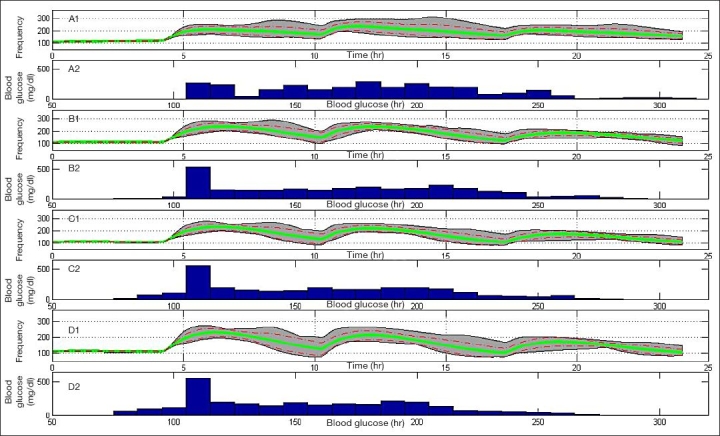
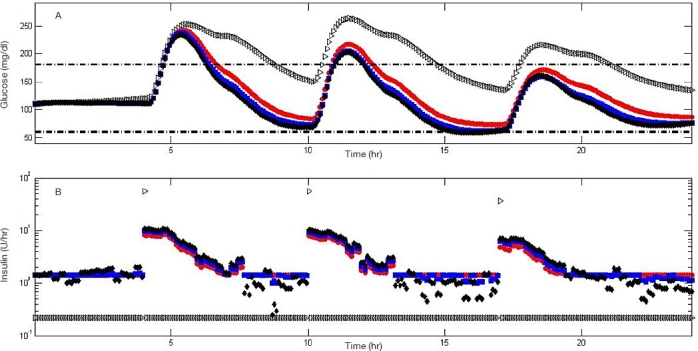
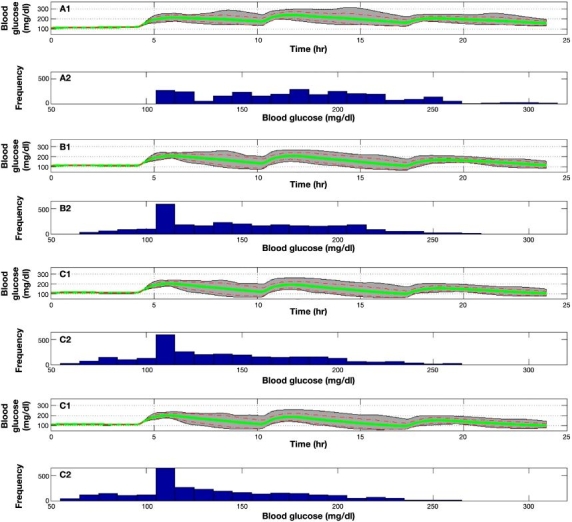
Method: An artificial pancreatic beta-cell based on zone model predictive control (zone-MPC) that is tuned automatically has been evaluated on the University of Virginia/University of Padova Food and Drug Administration-accepted metabolic simulator. Zone-MPC is applied when a fixed set point is not defined and the control variable objective can be expressed as a zone. Because euglycemia is usually defined as a range, zone-MPC is a natural control strategy for the artificial pancreatic beta-cell. Clinical data usually include discrete information about insulin delivery and meals, which can be used to generate personalized models. It is argued that mapping clinical insulin administration and meal history through two different second-order transfer functions improves the identification accuracy of these models. Moreover, using mapped insulin as an additional state in zone-MPC enriches information about past control moves, thereby reducing the probability of overdosing. In this study, zone-MPC is tested in three different modes using unannounced and announced meals at their nominal value and with 40% uncertainty. Ten adult in silico subjects were evaluated following a scenario of mixed meals with 75, 75, and 50 grams of carbohydrates (CHOs) consumed at 7 am, 1 pm, and 8 pm, respectively. Zone-MPC results are compared to those of the "optimal" open-loop preadjusted treatment.
Results: Zone-MPC succeeds in maintaining glycemic responses closer to euglycemia compared to the "optimal" open-loop treatment in te three different modes with and without meal announcement. In the face of meal uncertainty, announced zone-MPC presented only marginally improved results over unannounced zone-MPC. When considering user error in CHO estimation and the need to interact with the system, unannounced zone-MPC is an appealing alternative.
Conclusions: Zone-MPC reduces the variability of control moves over fixed set point control without the need to detune the controller. This strategy gives zone-MPC the ability to act quickly when needed and reduce unnecessary control moves in the euglycemic range.
2010 Diabetes Technology Society.
Figures
Similar articles
-
Overnight closed-loop insulin delivery with model predictive control: assessment of hypoglycemia and hyperglycemia risk using simulation studies.J Diabetes Sci Technol. 2009 Sep 1;3(5):1109-20. doi: 10.1177/193229680900300514. J Diabetes Sci Technol. 2009. PMID: 20144424 Free PMC article.
-
Advanced hybrid artificial pancreas system improves on unannounced meal response - In silico comparison to currently available system.Comput Methods Programs Biomed. 2021 Nov;211:106401. doi: 10.1016/j.cmpb.2021.106401. Epub 2021 Sep 13. Comput Methods Programs Biomed. 2021. PMID: 34560603
-
Zone-MPC Automated Insulin Delivery Algorithm Tuned for Pregnancy Complicated by Type 1 Diabetes.Front Endocrinol (Lausanne). 2022 Mar 22;12:768639. doi: 10.3389/fendo.2021.768639. eCollection 2021. Front Endocrinol (Lausanne). 2022. PMID: 35392357 Free PMC article.
-
Glucose-responsive insulin delivery for type 1 diabetes: The artificial pancreas story.Int J Pharm. 2018 Jun 15;544(2):309-318. doi: 10.1016/j.ijpharm.2017.12.022. Epub 2017 Dec 16. Int J Pharm. 2018. PMID: 29258910 Review.
-
[What is the current state of the artificial pancreas in diabetes care?].Internist (Berl). 2020 Jan;61(1):102-109. doi: 10.1007/s00108-019-00713-y. Internist (Berl). 2020. PMID: 31863132 Review. German.
Cited by
-
Modelling the effect of insulin on the disposal of meal-attributable glucose in type 1 diabetes.Med Biol Eng Comput. 2017 Feb;55(2):271-282. doi: 10.1007/s11517-016-1509-6. Epub 2016 May 7. Med Biol Eng Comput. 2017. PMID: 27155940
-
A Review of Emerging Technologies for the Management of Diabetes Mellitus.IEEE Trans Biomed Eng. 2015 Dec;62(12):2735-49. doi: 10.1109/TBME.2015.2470521. Epub 2015 Aug 19. IEEE Trans Biomed Eng. 2015. PMID: 26292334 Free PMC article. Review.
-
Clinical evaluation of an automated artificial pancreas using zone-model predictive control and health monitoring system.Diabetes Technol Ther. 2014 Jun;16(6):348-57. doi: 10.1089/dia.2013.0231. Epub 2014 Jan 28. Diabetes Technol Ther. 2014. PMID: 24471561 Free PMC article.
-
MPC Design for Rapid Pump-Attenuation and Expedited Hyperglycemia Response to Treat T1DM with an Artificial Pancreas.Proc Am Control Conf. 2014 Jun;2014:4224-4230. doi: 10.1109/ACC.2014.6859247. Epub 2014 Jul 21. Proc Am Control Conf. 2014. PMID: 28479660 Free PMC article.
-
Application of Zone Model Predictive Control Artificial Pancreas During Extended Use of Infusion Set and Sensor: A Randomized Crossover-Controlled Home-Use Trial.Diabetes Care. 2017 Aug;40(8):1096-1102. doi: 10.2337/dc17-0500. Epub 2017 Jun 5. Diabetes Care. 2017. PMID: 28584075 Free PMC article. Clinical Trial.
References
-
- Skyler JS. Atlas of diabetes. 3rd ed. Philadelphia: Current Medicine Group LLC; 2005.
-
- Albisser AM, Leibel BS, Ewart TG, Davidovac Z, Botz CK, Zingg W. An artificial endocrine pancreas. Diabetes. 1974;23(5) - PubMed
-
- Pfeiffer EF, Thum C, Clemens AH. The artificial beta cell—a continuous control of blood sugar by external regulation of insulin infusion (glucose controlled insulin infusion system) Horm Metab Res. 1974;6(5):339–342. - PubMed
-
- Clemens A, Hough D, D’Orazio P. Development of the Biostator glucose clamping algorithm. Clin Chem. 1982;28(9):1899–1904. - PubMed
-
- Steil GM, Panteleon AE, Rebrin K. Closed-loop insulin delivery—the path to physiological glucose control. Adv Drug Deliv Rev. 2004;56(2):125–144. - PubMed
Publication types
MeSH terms
Substances
Grants and funding
LinkOut - more resources
Full Text Sources
Other Literature Sources
Medical
Miscellaneous
