

Review
doi: 10.1016/j.cbpa.2010.06.176.
Epub 2010 Jul 19.
Drug-target residence time: critical information for lead optimization
Affiliations
- PMID: 20663707
- PMCID: PMC2918722
- DOI: 10.1016/j.cbpa.2010.06.176
Item in Clipboard
Review
Drug-target residence time: critical information for lead optimization
Curr Opin Chem Biol.
2010 Aug.
Abstract
Failure due to poor in vivo efficacy is a primary contributor to attrition during the development of new chemotherapeutics. Lead optimization programs that in their quest for efficacy focus solely on improving the affinity of drug-target binding are flawed, since this approach ignores the fluctuations in drug concentration that occur in vivo. Instead the lifetime of the drug-target complex must also be considered, since drugs only act when they are bound to their targets. Consequently, to improve the correlation between the in vitro and in vivo activity of drugs, measurements of drug-target residence time must be incorporated into the drug discovery process.
2010 Elsevier Ltd. All rights reserved.
Figures
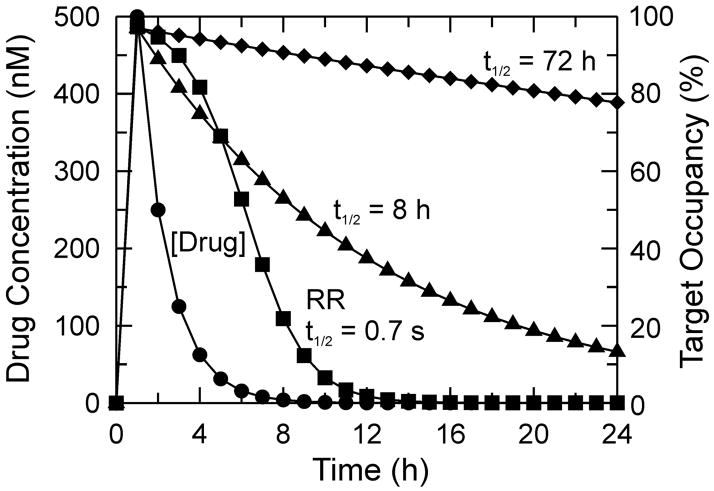
An analysis that demonstrates how residence time affects the amount of drug-target complex (pharmacodynamics) as a function of time. The drug is assumed to reach a maximum concentration (Cmax) of 500 nM at the target site 1 h after dosing, and to have an elimination half-life of 1 h (pharmacokinetics) so that the drug concentration at time t is given by D(t) = Cmax * 2(−t/1) (●). The fractional occupancy of the target by the drug, given as a percentage, is shown for three drugs all of which have equilibrium dissociation constants of 14 nM for the final drug-target complex (DT for a rapid reversible inhibitor, DT* for a slow-onset inhibitor) so that at Cmax (500 nM), the target in each case is 97 % occupied by drug (500/(500+14)). This assumes that the concentration of target is ≪ 500 nM and that no substrate is present to compete for binding to the target. For the histone deacetylase inhibitor pimelic diphenylamide 106 [–7], the percent target occupancy has been plotted as a function of time using a drug-target complex half-life (t1/2) of 8 h (the koff value for this inhibitor is 0.086 h−1 and tR = 11.6 h) (▲). The percent target occupancy at time t is then given by %occupancy = 97 * 2(−t/8) assuming that the drug does not rebind to the target (i.e independent of the free drug concentration). A similar analysis has been performed for a hypothetical drug with t1/2 = 72 h (tR = 104 h) (◆). Also shown is the percent target occupancy for a rapid reversible (RR) drug calculated directly from the Kd value of 14 nM where %occupancy = 97 * (D(t)/(D(t)+Kd) and D(t) is the drug concentration at time t as calculated previously (◾).
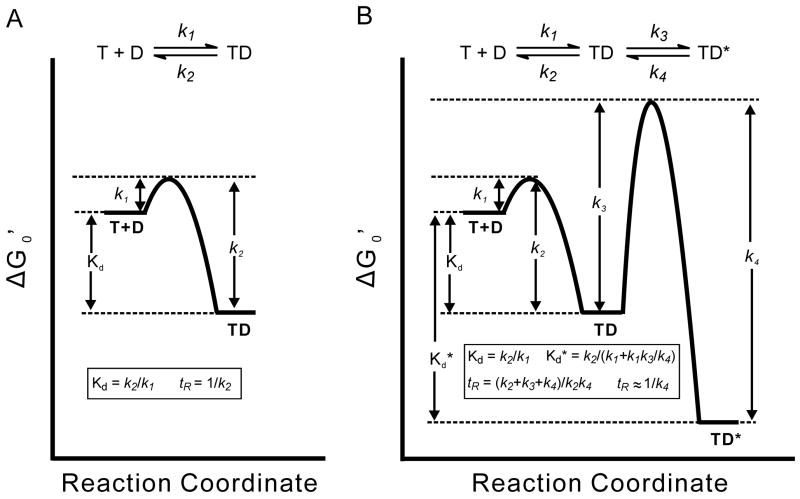
T and D refer to target and drug respectively. A) One-step binding mechanism, in which k1 and k2 are the forward and reverse rate constants, respectively, and Kd is the dissociation constant. B) Two-step induced fit binding mechanism. k1 and k2 are the rate constants for formation of the initial TD complex, while k3 and k4 are the rate constants for the isomerization step leading to the final TD* complex. In the example shown k3 and k4 are small so that formation and breakdown of TD* is slow. Kd is the dissociation constant of TD, while Kd* is the dissociation constant of TD* and determines the true affinity of the drug for its target.
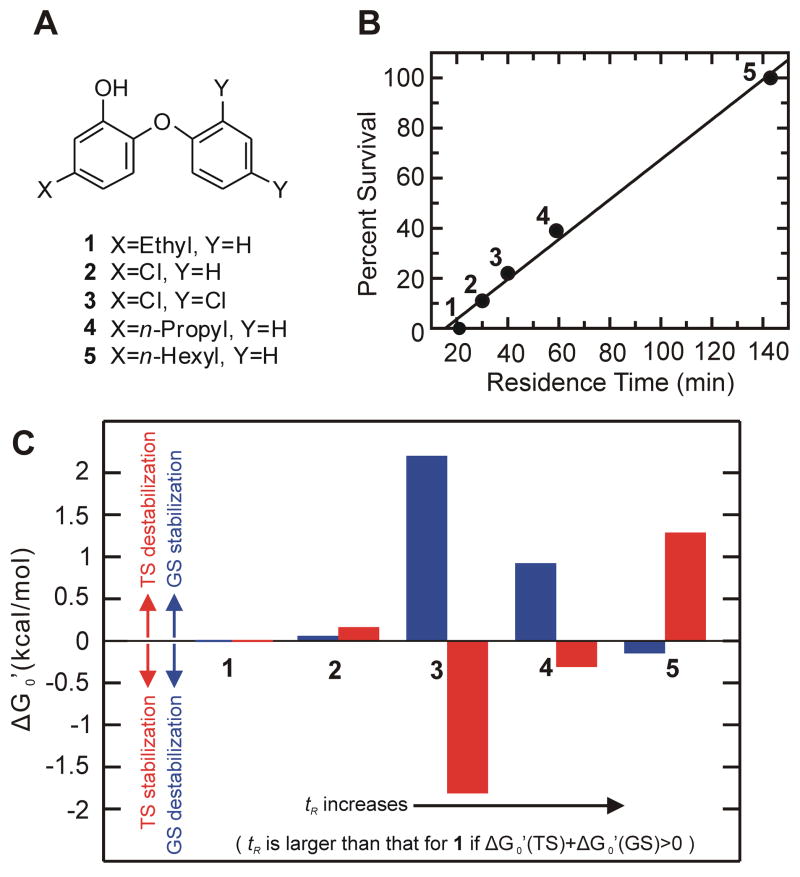
A) Structures of the diphenyl ether inhibitors. B) Linear correlation between tR and in vivo efficacy [18]. C) Ground state (GS) and transition state (TS) contributions to the residence time of each compound. Changes in the free energy of the ground state have been calculated at 298K relative to compound 1 which has the shortest residence time. The change in ground state free energy of compound x relative to the compound 1 is given by ΔGGS = −RTln(Ki(x)/Ki(1)), where Ki(1) and Ki(x) are the equilibrium dissociation constants for the two compounds from ftuFabI, and R=1.986 calK−1mol−1. In order to determine how the change in transition state free energy contributes to the change in residence time, the change in transition state free energy between the two compounds is given by △GTS = −RT(ln(Ki(1)/Ki(x))−ln(koff(1)/koff(x))), where koff(1) and koff(x) are the dissociation rate constants of the two compounds from ftuFabI. Ground state (GS) contributions are shown in blue, where a positive value indicates the ground state has been stabilized relative to the standard state while a negative value reflects a relative destabilization of the ground state. Transition state (TS) contributions are shown in red, where positive values indicate transition state destabilization and negative values indicate transition state stabilization relative to the standard state.
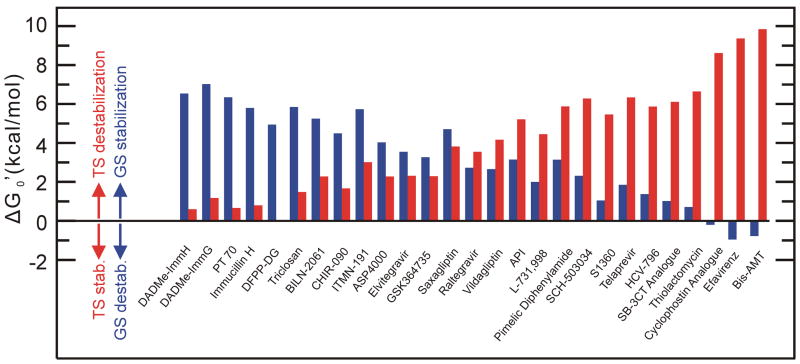
Changes in the free energy of the ground state (GS) and transition state (TS) for each compounds in Table 1 has been calculated relative to a transient-binding drug with a thermodynamic affinity of 1 μM for its target and a drug-target residence time (tR) of 0.01s (koff = 100 s−1). △GGS and △GTS have been calculated as described in the legend to Figure 2: △GGS = −RTln(Ki(x)/1×10−6), and △GTS = −RT(ln(1×10⁻⁶/Ki(x))−ln(100/koff(x))). Ground state (GS) and transition state (TS) contributions are shown in blue and red, respectively, as defined for Figure 2.
References
-
- Kola I, Landis J. Can the pharmaceutical industry reduce attrition rates? Nat Rev Drug Discov. 2004;3:711–715. - PubMed
-
- Tummino PJ, Copeland RA. Residence time of receptor-ligand complexes and its effect on biological function. Biochemistry. 2008;47:5481–5492. A recent reivew that discusses the differences between closed (in vitro) and open (in vivo) systems, and describes the different mechanisms that underpin slow binding inhibition. This paper also gives examples of long residence time receptor-ligand complexes and discusses the implications of this for drug development. - PubMed
-
- Copeland RA, Pompliano DL, Meek TD. Drug-target residence time and its implications for lead optimization. Nat Rev Drug Discov. 2006;5:730–739. One of the early reviews that discusses the concept of drug-target residence time and the role that long residence time can have on in vivo drug efficacy and target selectivity. This paper also gives examples of drugs that have long residence times on their targets. - PubMed
-
- Swinney DC. The role of binding kinetics in therapeutically useful drug action. Curr Opin Drug Discov Devel. 2009;12:31–39. This paper descibes how drug-target binding kinetics can infuence clinical efficacy, duration of action, clinical differentiation and safety. Based on this, it is proposed that the optimization of binding kinetics can be used to maximize a drug’s therapeutic window and reduce attrition rates. - PubMed
-
- Copeland R. The dynamics of drug-target interactions: drug target residence time and its impact on efficay and safety. Expert Opin Drug Discov. 2010;5:1–6. - PubMed
Publication types
MeSH terms
Substances
Grants and funding
LinkOut - more resources
Full Text Sources
Other Literature Sources
